In March 2022, the US central bank began tightening monetary policy in response to rapidly rising inflation. Since then, the target rate for monetary policy has been increased at each meeting of the Federal Open Market Committee (FOMC), and now stands at 5%. The aim of these decisions is to bring inflation back towards the Federal Reserve’s 2% target. After peaking in the summer of 2022, inflation has fallen in line with the fall in energy prices. Thus far, economic activity has been resilient, and the unemployment rate has remained stable despite the tighter monetary and financial conditions. Will inflation continue to fall, and, more importantly, can it converge on the target without pushing up unemployment?
Inflation under control?
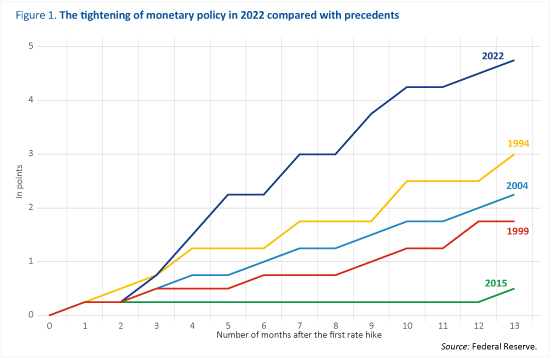
The Federal Reserve had been cautious throughout 2021, under the view that the increase in prices would be transitory. It was not until March 2022 that it began tightening, just over a year after inflation began to rise above the 2% target, when it had reached 6.8%[1]. The rise in prices has in fact proved to be more prolonged than FOMC members had anticipated and has spread to all components of the index. Finally, the central bank also feared the risk of a disconnection in inflation expectations, which would have sustained an inflationary spiral. Once it began to act, rate hikes occurred in rapid succession, with the target rate for federal funds rising from 0.25% to 5% in one year, i.e. a much faster pace of tightening than that observed in previous cycles (Figure 1), and in particular during the course of 2015, when the Federal Reserve had raised rates only twice in one year, and each time by only 0.25 points.

Inflation peaked just a few months after the tightening started. From 7% year-on-year in June 2022, it gradually fell to 5% in February 2023. However, this decline was not due to the Federal Reserve, but mainly reflected changes in the energy component, which is itself directly linked to the fall in oil prices and, to a lesser extent, in the price of American gas[2]. In February 2023, the energy component of the consumption deflator fell by 0.9% year-on-year, whereas it had risen by 60.8% in June 2022. Although the food price index remains dynamic, its rise is also stalling.
Looking beyond the energy factor, is the decline in inflation sustainable? Assuming that oil and gas prices remain stable, the contribution of energy prices will indeed push US inflation down further in coming months. However, the end of the inflationary episode will depend mainly on trends in core inflation, which of course includes a diffusion effect of energy prices but whose dynamics depend mainly on supply and demand factors[3].
Is a rise in unemployment inevitable?
Excluding energy and food prices, so-called core inflation also shows signs of slowing down. In February 2023, it rose by 4.6% year-on-year, compared with 5.2% in September 2022. This dynamic can be explained in part by the evolution of durable goods prices, which were hit during 2022 by supply difficulties[4]. The indicator measuring the pressure on production lines has fallen sharply and, since the beginning of 2023, has returned below its long-term average value[5]. The impact of monetary policy will mainly be transmitted via demand. Indeed, the increase in the target rate for monetary policy has been passed on to all public and private rates, market rates and bank rates. The consequent tightening of monetary and financial conditions should result in a tapering of credit activity and a slowdown in domestic demand: consumption and investment.

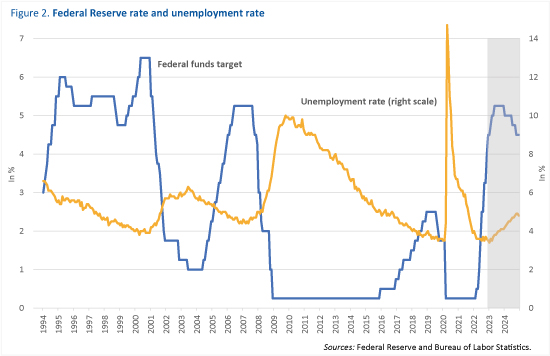
However, after GDP fell in two quarters at the beginning of 2022, it recovered in the second half of the year. Most importantly, the unemployment rate remains at a historically low level: 3.5%, according to the Bureau of Labor Statistics (BLS) for the month of March 2023. Is this situation – falling inflation without rising unemployment – sustainable? If so, the Federal Reserve would succeed in achieving its price target while avoiding recession or at least rising unemployment. Olivier Blanchard seemed to doubt this optimistic scenario. Indeed, most macroeconomic analyses suggest that a restrictive monetary policy pushes up unemployment. For example, the variant of the FRB-US model suggests that a one-point interest rate hike results in a 0.1 point rise in unemployment in the first year and then peaks at 0.2 points in the second and third years. Recent analysis by Miranda-Agrippino and Ricco (2021) suggests a similar order of magnitude, with a peak of around 0.2 points for a one-point increase in the policy rate, but faster transmission[6]. Given the magnitude of the monetary tightening and all else being equal, we expect the unemployment rate to rise by 0.3 percentage points in 2023, which in our scenario would bring it to 3.9% from 3.6% on average over 2022. Indeed, given the lags in the transmission of monetary policy, the tightening over 2022 is likely to have only a small impact, which could explain why the unemployment rate has not yet risen. Previous episodes of monetary tightening have also been characterised by a more or less significant lag between the tightening phase of monetary policy and an increase in unemployment (Figure 2). For example, the Federal Reserve’s moves to tighten monetary policy in the summer of 2004 did not have a rapid impact on the unemployment rate, which continued to fall until the spring of 2007, before rising sharply thereafter, reaching a peak of almost 10% in early 2010 in the context of the global financial crisis. The same inertia was evident after 2016, with unemployment not rising until 2020 during the lockdowns.
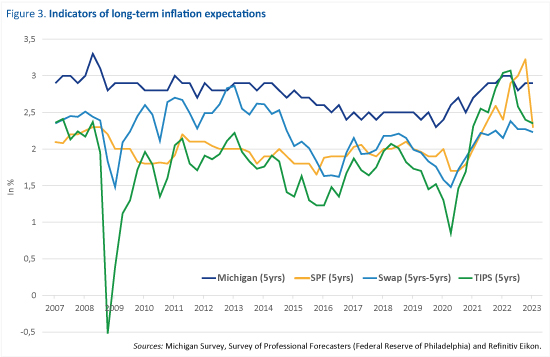
Finally, the capacity of monetary policy to reduce inflation depends not only on the relationship between unemployment and inflation but also on the reaction of inflation expectations. In this regard, the various indicators of long-term expectations suggest either stability or a slight decrease. For example, the Michigan Household Survey indicates a 5-year inflation expectation of 2.8% in February 2023, compared with 3.1% in June 2022. According to market indicators, 5-year 5-year forward inflation expectations fluctuate around 2.5%. These levels are certainly higher than the target set by the Federal Reserve, but they do not reflect a significant and lasting shift away from what was observed before 2021 (Figure 3). As for the inflation-unemployment link, it is clear that there is greater uncertainty. In the FRB-US model, the increase in unemployment induced by monetary tightening has very little effect on the inflation rate, although the estimates of Miranda-Agrippinon and Ricco (2021) suggest a greater impact. In our scenario, US inflation would continue to fall in 2023 not only because of the energy component but also because of a fall in core inflation. In our scenario, we assume that by the end of 2023, the deflator would rise by 3.6% year-on-year, with core inflation at 3.7%.

________________________________
[1] This is inflation measured by the consumer price deflator, which is the index monitored by the Federal Reserve. In comparison, inflation measured by the consumer price index (CPI) is on average higher, whether we consider the overall indicator or the index excluding food and energy prices.
[2] The price of gas on the US market has not reached the highs seen in Europe. However, the price almost tripled between the spring of 2021 and the end of summer 2022 before returning to the low point observed in April 2020.
[3] The contribution of food has already fallen since the start of the year, and we anticipate that this will continue.
[4] This is the case for semiconductors, used in particular by the automotive sector. These shortages have contributed to the rise in the prices of cars, both new and especially used, which rose by more than 40% year-on-year at the beginning of 2022.
[5] See the Global Supply Chain Pressure Index (GSCPI), which is calculated by economists at the New York Federal Reserve.
[6] See Miranda-Agrippino S. & Ricco G. (2021), “The transmission of monetary policy shocks”, American Economic Journal: Macroeconomics, 13(3), 74-107. Other estimates indicate effects that are sometimes greater, depending on the estimation strategy. See the simulations reported by Coibion O. (2012), “Are the effects of monetary policy shocks big or small?”, American Economic Journal: Macroeconomics, 4(2), 1-32.