The shortfall in European investment
Sébastien Bock, Aya Elewa, Sarah Guillou, Mauro Napoletano, Lionel Nesta, Evens Salies, Tania Treibich
Since Robert Solow’s early work, we have known that long-term economic growth does not come from a larger capital stock or increased employment, but from technical progress, identified as the unobserved part of growth. This unobserved element – the Solow residual – explained 87% of US growth in the first half of the 20th century. Since then, theories of endogenous growth have shown that it is above all intangible investment, particularly investment in R&D or human capital, which, as a source of positive externalities, ensures long-term growth.
Information and communication technologies (ICT) have focused the attention of researchers and statisticians since the late 1990s. Although they have not always lived up to their promise of productivity gains – the Solow paradox – they are undeniably the lifeblood of all the technologies of the 21st century, and are the weapons of competitiveness for all sectors, especially digital services. Taking an interest in investment in these technologies is an essential part of any discussion of growth and living standards.
In this post, we focus on three types of investment, one tangible, and the other two intangible, which may be at the root of the European economic backwardness relative to the United States analysed in greater detail in our Policy brief ” Documenting the widening transatlantic gap“. We are looking at investment in ICT equipment (servers, routers, computers, etc.), investment in research and development (R&D), and investment in ICT services such as software, programs and databases.[1] These three types of investment stand out from other tangible investments (in transport equipment, machinery, buildings, farmland) and intangible investments (in training, intellectual property, organisation) because of their particular dynamics, revealing a growing and sometimes spectacular lag between the eurozone and the United States.
Let’s first look at the dynamics of investment.
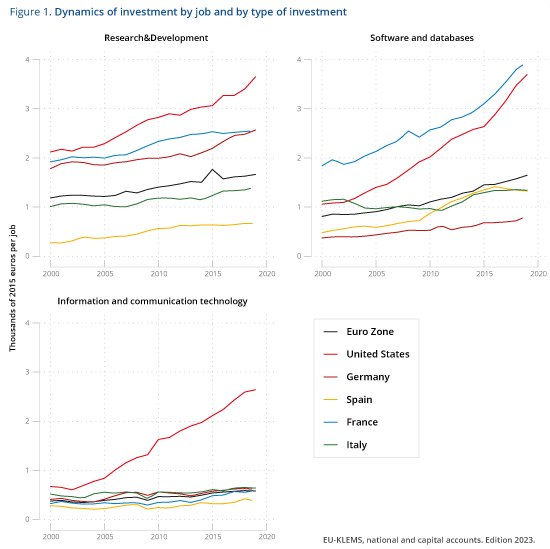
Figure 1 shows investment per job for these three types of investment in the United States, the eurozone and the four major eurozone countries from 2000 and 2019. It appears that the investment effort in the United States is greater for each of them.
- In terms of R&D investment, the gap between the United States and the eurozone, which was already wide in the early 2000s, is widening in absolute terms (from €1,000 to €2,000 per job over the period) to represent more than twice the European effort in 2019. What we find most worrying is that this widening gap is the result of uniform behaviour on the part of the main European economies. For both Germany and France, this gap, which was rather small until 2005, is multiplied by 10 for France and by 5 for Germany at the end of the period.
- Concerning investment in software and databases, and leaving aside the French case[2] , there is no reason to be optimistic. The US-EZ gap in investment per job in software and databases has increased 12-fold, from €200 to €2,400 over the two decades. France stands out in terms of volume, but the trend is for French investment to double while US investment triples.
- Concerning investment in ICT equipment, the American singular achievement is even more impressive. Initially close to European levels, this investment is growing steadily in the United States, while remaining constant in the eurozone. The comparison is eloquent here, since investment per job remains at between 500 and 700 euros per year over the entire period in the eurozone, whereas it reaches 2,500 euros in the United States, a nearly five-fold increase over the period in question.
Overall, the private investment gap between the eurozone and the United States stood at around 150 billion euros in 2000, rising to over 600 billion euros in 2019. Where does this US vigour come from, and above all, how can we explain Europe’s apathy? The first question we might ask is the role of the productive specialisation of economies. After all, if the sectors that are growing in the US are those that invest the most in R&D, software and ICT equipment, we should see greater composition effects in the US than in the eurozone. This would imply that the growth observed is not the result of American behaviour that is increasingly inclined towards investment but is above all the result of an advantageous sectoral positioning for the United States. Let’s now decompose investment growth by distinguishing between intra- and inter-sectoral effects.
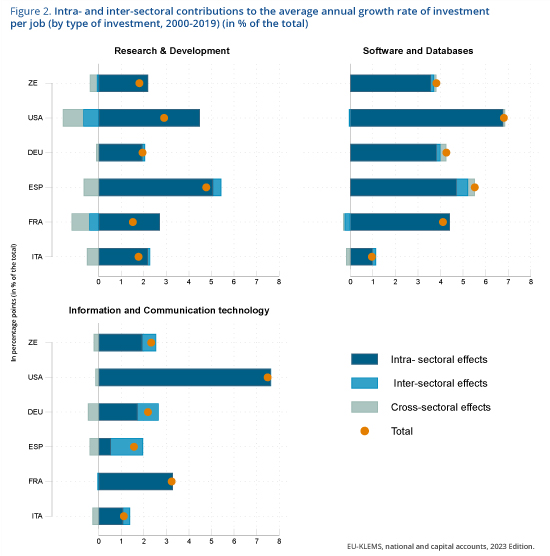
By positing aggregate investment per job as the sum of investment per job in each sector weighted by the share of employment in those sectors, the growth rate of aggregate investment per job can be decomposed as the sum of intra-sectoral effects, inter-sector al effects and cross-sectoral effects over the period.
The first effect captures the source of change linked to the increase in investment (per job) taking place within each sector. This internal effect may be the result of companies increasing their investment between 2000 and 2019, market share reallocations within sectors, or firms entering and leaving the market. The second effect, the cross-sectoral effect, is the result of structural change in economies, understood as changes in the sectoral structure of economies. The cross-sectoral effect is the combination of the first two effects.
Figure 2 presents the results of this decomposition, distinguishing between the effects within each sector and those between sectors. We can immediately see that it is the intra-sectoral effect that explains the growth in per capita investment, and this applies across all economies and all types of investment. In other words, the explanation that structural change is taking place in such a way as to favour growth in investment per job in the United States and not in Europe can be rejected. Not only are the sectoral structures of the economies not that far apart, but above all the investment growth is clearly the result of an investment intensification within sectors. We therefore need to understand the origin of the US-EZ investment gap as the result of investment behaviour that changes over time.
To reveal them, we use another decomposition, where the growth rate of investment per job is the result of the growth rate of investment minus the growth rate of employment. Next, we decompose the investment growth rate as the sum of the sectoral growth rates, weighted by each sector’s share of total investment, at the start of the period. We classify all the sectors that make up the market economy by type of sector as follows: (i) high-tech industries (excluding ICT production); (ii) ICT production industries; (iii) other industries, agriculture, water, gas, electricity, construction; (iv) high-value-added services (excluding ICT services); (v) ICT services; (vi) other services. This classification seems relevant to us because it distinguishes ICT production activities (whether manufactured or services) from other sectors that use ICTs as inputs in their production.
Figure 3 shows the results by type of investment. Let’s look first at R&D investment. The case of Spain may seem surprising in terms of the growth observed, but this is above all the result of a catch-up effect. Indeed, as figure 1 shows, it is in Spain that investment per job is the lowest throughout the period under consideration. This growth is essentially driven by high value-added services and ‘low-tech’ industries. In the other countries, growth in investment per job is mainly driven by high-tech industries. This is particularly true of the eurozone in general, and Germany and Italy in particular. The differential between the US and European growth rates (excluding Spain) is mainly the result of major investment by the ICT services sectors. Here we see above all the famous GAFAMs.[3] The exploitation of gigantic databases combined with the rise of artificial intelligence – and the impressive possibilities it offers – are prompting the GAFAMs to invest massively in R&D in order to make the most of these new technologies.
Growth in investment in databases and software is mainly due to the services sector in general, whatever the country. What distinguishes the US from other countries is the significant contribution made by high value-added services. This suggests that ICTs are spreading more rapidly throughout the economic activities in the United States than in Europe. Italy stands out for its low growth rate, with services making virtually no contribution to the growth of this investment. The case of Spain is, once again, the expression of a catch-up effect, as shown in Figure 1.
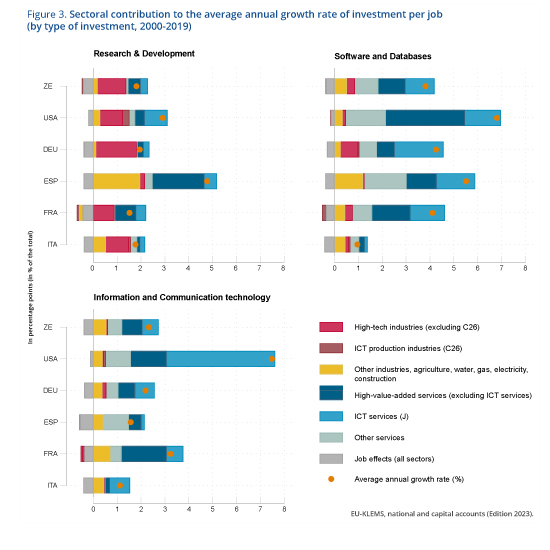
Finally, the US-EZ comparison of the sources of growth in investment in ICT equipment is particularly enlightening. Over and above the difference in growth rates, we note that the contribution of the sectors is relatively similar between the two regions of the world, except for ICT services. In the eurozone, the contribution of ICT services to growth in investment in ICT equipment remains low, whereas in the United States it is 4.5 percentage points, which alone explains the difference observed. Our interpretation is that the specific dynamics of investment in ICT equipment observed in Figure 1 is the result of massive investment by ICT services, i.e. essentially by GAFAMs and sisters (Intel, Nvidia…). In other words, intangible investment in R&D and software/databases is evolving in tandem with tangible investment in ICTs, which complements it and makes it operational or even productive.
Three results to remember :
- The investment effort in the United States is greater than in the eurozone for the three types of investment considered: R&D, ICT equipment and ICT services (software and databases).
- The gap between the United States and the eurozone is widening for all types of investment.
- In 2019, investment in ICT equipment per job will be five times higher in the United States than in the eurozone.
- It is the intra-sectoral effect that explains the growth in investment per job, in all economies, and for all types of investment.
- The gap between the United States and the eurozone is therefore not because of changes in specialisation (over the last 20 years), but rather to changes within sectors.
- The origin of the investment gap the contribution of ICT services to growth in investment in ICT equipment is the result of investment behaviour that changes over time.
- There are significant differences between countries in terms of sectoral contributions to growth in investment per job.
- In the eurozone, growth in R&D investment is being driven mainly by high-tech industries. In the United States, it is mainly ICT services that are driving this growth;
- What distinguishes the United States from other countries is the significant contribution of high value-added services to the growth in investment in databases and software;
- The difference in investment in ICT equipment is mainly due to investment by the services sector.
It is as if, in the United States, the ICT services sector – including the five American giants – was responsible for the observed differential, with its heavy investment in R&D and digital equipment. The other service sectors (essentially high value-added services) are integrating these innovations into their production processes by investing in software and databases. The US case thus offers a high degree of coherence through the complementarity between sectors that produce and sectors that use ICT services. The overall impression is one of rapid digitisation of the economy, driven by GAFAMs and spreading to the entire US production base.
The European case does not offer the same picture, and is worrying for two reasons. Firstly, the lack of investment in ICT services means that the economy is digitised more slowly. Secondly, the absence of a leading company in the field of digital services limits investment in R&D and digital equipment. With the future promises of artificial intelligence and quantum computing, there is every reason to believe that, without the combination of upstream sectors supplying ICT services and equipment and downstream sectors adopting these innovations, Europe will find it more difficult to capture the fruits of the announced digitisation of the economy.
The challenge is therefore immense. Catching up would mean increasing private investment[4] in Europe by €630 billion a year (or more than 5% of the eurozone’s GDP), for the assets considered here alone (ICTs, R&D, software and databases), and assuming that US investment remains constant. This is equivalent to an increase in investment of €61 billion for France, €57 billion for Germany, €28 billion for Italy and €16 billion for Spain. But this is not just a quantitative problem, far from it. Without a radical change in the investment behaviour of public and private players, and institutional innovation in European governance[5] , this paradox is likely to persist in Europe, which, by remaining anchored in the productions of the 20th century, is clearly at risk of technological decline.
[1] It should be remembered that these investments may result from in-house production or be purchased from external suppliers.
[2] Guillou and Mini have highlighted the enigmatic French peculiarity in software and databases, which persists despite the differences in accounting between countries. See “A la recherche de l’immatériel : comprendre l’investissement de l’industrie française“, La Fabrique de l’industrie (2019).
[3] As a reminder, the GAFAMs are : Google (now Alphabet), Amazon, Facebook (Meta), Apple and Microsoft.
[4] The private sector corresponds to sectors with NACE codes from A to N.
[5] On this point, see the recent report by Fuest, D. Gros, P.-L. Mengel, G. Presidente and J. Tirole, “EU Innovation Policy: How to escape the middle technology trap“, April 2024, A Report by the European Policy Analysis group.