Livret A accounts – drowning in criticism

By Pierre Madec

As the Governor of the Bank of France and the Minister of the Economy and Finance announced a further (probable) reduction in the interest rate on Livret A accounts for August 1st, the rating agency Standard&Poor’s (S&P) released a study of the French banking system. The U.S. agency argues that Livret A accounts, and regulated savings more generally, “penalize French banks” and are at the root of “distortions in the banking market”. This debate, which is hardly new, has been the subject of a number of reports: Duquesne, 2012; Camdessus, 2007; Noyer-Nasse, 2003, and more. Some ardently defend the peculiar French approach represented by Livret A, while others advocate, on the contrary, a deep-going reform of a system they describe as “lose-lose”.

So what’s the actual situation? Do Livret A accounts really threaten the French banking system? How are the household savings deposited in them used? What has been the impact of the series of increases in the ceilings on deposits? What will be the impact of the (probable) new rate cut proposed by the Minister of Economy and Finance, Pierre Moscovici, both for savers and for the financing of social housing? We provide a few answers below.

What are Livret A accounts?

Livret A accounts date from almost 195 years ago. They are a regulated investment that gives the right to a fiscal benefit (exemption from all taxation and social charges), with guaranteed deposits at a rate set by the State [1].

In 2011, the French savings rate was 16% on average, which was 1.1 points higher than in 2006. The increase in the savings rate went largely into regulated savings, and especially into Livret A accounts, which are held by 63.3 million French people, with total savings of 230 billion euros in April 2013, twice the level of January 2007. Three successive developments contributed to this massive increase in total holdings: the financial crisis, which redirected a portion of household savings into risk-free investments; the widespread distribution of Livret A passbooks to all banks after 1 January 2009, under the Act to modernize the economy [2]; and finally, the 50% increase in the ceiling on Livret A accounts, which took place in two stages (in October 2012 and January 2013). This growing attraction for Livret A is also due to the full liquidity of the accounts and the deposit guarantee – neither of which is available, for example, for life insurance.

What is the role of Livret A accounts?

One of (many) specific features of the French model for financing housing is (among others) that providers of social housing do not draw on the bond markets (Levasseur, 2011). Social landlords are therefore financed mainly (73% in 2012) by the Caisse des Depots et Consignations (CDC), where a portion of household’s Livret A savings are deposited. The CDC operates a savings fund that centralizes 65% of Livret A holdings, which in April represented more than 150 billion euros (Banque de France). The deposits made available are used primarily for lending for social housing and urban policy [3]. These borrowings are largely used for the construction, acquisition and rehabilitation of social rental housing by social landlords (HLM bailleurs), but they can also be used to finance specific housing operations and urban policy measures such as the National urban renovation plan (“NERP”). In order to secure the deposits and ensure the savings fund has the amounts needed, the amount of deposits centralized under Livret A funds must always be greater than or equal to 125% of the outstanding loans for social housing and urban policy granted by the CDC.

It is obvious that the target of building 150,000 social housing units per year (compared to 105,000 in the year 2012) will give rise to a significant increase in the sector’s financing needs [4]. To meet this goal, 13.7 billion euros in lending for social rental housing will need to be granted for one year in 2013, i.e. 4 billion more than in 2012.

Finally, the Livret A resources that are not centralized by the CDC (80 billion euros) are subject to a “duty of use”. Eighty percent must be used by the banks for financing SMEs while 10% must be used to finance energy savings measures in existing buildings [5]. Similarly, a certain number of local government investment programmes (Campus Plan, 2012 Hospital plan, Grenelle Environment programme) have benefited from Livret A funds.

Are Livret A accounts endangering the French banking system?

Given the increasing interest of households in regulated savings (especially Livret A), one might think (like S&P) that this type of investment threatens the banking system by depleting bank liquidity, which has already been undermined by the crisis. The higher ceilings established ​​in recent months have indeed led – in essence – to a transfer of savings to tax-exempt investments, whose share in total household financial savings increased by 0.6 percentage point between 2011 and 2012. In October 2012, there was a significant drop in savings accounts subject to tax (‑12 billion euros), a drop that can be explained in part by the higher ceilings on Livret A accounts (+6 billion euros) [6] (see Figure 1).

graph1_1707PMblog-English


It is important to put S&P’s alarmist declarations into perspective – on the one hand, because, except for the month of October 2012, the flow from taxed accounts has been relatively stable, and on the other hand, because in 2012 regulated savings, although up significantly, accounted for only 9.5% (6.2% of which for Livret A) of total household financial savings, which amounted to 3,664 billion euros. In addition, if there were a real and lasting lack of liquidity, technical adjustments exist or can be made. According to the latest annual report of the Cour des comptes (French Court of Auditors), at the beginning of the year the coverage ratio of savings deposits was 156% of outstanding loans to social housing and urban policy, instead of the regulatory 125%. This over-coverage represents about 50 billion euros, which are allocated neither to the financing of social housing nor to bank liquidity. Now claimed by the banks, these funds are to be quickly allocated. As the savings fund has substantial liquidity, while leaving unchanged the ratios of coverage and of centralization (the fruit of bitter negotiations), it is clear that a number of temporary transfer mechanisms between the savings fund and the banking sector could quickly deal with any risk of a liquidity crisis. Finally, note that the banks have also benefited from the more widespread distribution of Livret A, notably through the payment by the savings fund of a commission on the amounts centralized. This commission, which is directly drawn on the funds for social housing, took 1 billion euros from the savings fund in 2012. Without drawing any conclusions about what should be done with these counterflows, it is questionable whether a better trade-off could be established between the centralisation rate and the coverage rate, the commission rate and the long-term funding of social housing [7].

What about the “probable” cut in the rates?

The reduction in Livret A rates, the proposal advanced on June 23 by the Minister of the Economy, Pierre Moscovici, who was echoing the statements made a few days earlier by the Governor of the Bank of France, Christian Noyer, should come into force on August 1, and is the result of a fall in the inflation rate on which it is partly indexed. What effect would this rate cut have on the flow of savings into Livret A accounts, and thus on the financing of social housing?

In May 2013, the interest rate on Livret A was 0.5% in real terms, a relatively low level. Over the period 2011-2012, it even came to an average of zero (see Figure 2). However, the net flow remained stable over the period. This is explained partly by the low rates offered by other investments, in particular taxed savings accounts such as the CEL home savings plan, which have had a negative real net rate since late 2009. Given the trade-offs made ​​by households, in particular the wealthiest ones, in their efforts to obtain the best return on their savings, it is relatively complex to demonstrate a strict correlation between the rate on Livret A accounts (real or nominal) and changes in the total outstandings. Thus, in the second half of 2009, Livret A suffered outflows even though the real rate on it was high; in 2010 and 2011, however, net deposits were high even though the rate was no longer so high.

Given, on the one hand, the lower real net rates offered by comparable investments and, secondly, current social and economic uncertainties, we can expect some stability in the flows during the second half of 2013, despite the decline in the rate of remuneration. This stability will obviously depend on the size of the rate reduction. As the rate is currently 1.75%, it seems unlikely that the high inflows will continue if the rate is revised below 1.25%. As France’s Economic commission expects inflation of 1.2% for 2013, fixing the Livret A rate below this would result in a fall in household purchasing power, which would go against the government’s commitments.

graph2_1107PMblog

Nevertheless, it should not be forgotten that this re-valuation in the rate is not automatic and in fact depends on a political decision. In the second half of 2009, while the collapse of inflation would have justified a decrease of 1.5 points to reduce the rate to 0.25%, the rate reduction ultimately applied was only 0.5 point, leaving the rate at 1.25%. An additional 2 billion euros was thus distributed to households. Conversely, in February 2012, given the return of higher inflation (even temporarily), the rate should have been lifted to 2.75%. The savings shortfall for households due to not changing the rate is estimated at 1 billion euros.

As with households’ choice between safety, liquidity and yields, the public trade-off between household purchasing power and the lending terms for social landlords can prove to be complicated. So while undervaluing the rate significantly benefits beneficiaries of the allocation of funds from Livret A (mainly social landlords) whose loan rates are “indexed” on the Livret A rate, it is disadvantageous for the saver.

While “small” savers are not very sensitive to changes in interest rates, “big” investors, that is to say, those approaching the deposit ceiling, can make rapid trade-offs out of Livret A. However, these 10% of the depositors, with the largest accounts, represent 51% of Livret A deposits. A massive reduction in rates could therefore lead to a significant outflow and subsequently substantially reduce the CDC’s capacity to lend to the social housing sector, a sector with ambitious building targets and mounting financing needs. On the contrary, it seems clear that maintaining higher rates during a period of low inflation would push up the cost of lending to social housing, at a time when the State and the housing agencies have committed to the construction of 120 000 social housing units per year between 2013 and 2015.


[1] For greater detail on the method of determining the interest rates, see Péléraux (2012).

[2] In January 2009, the total balance experienced a historic increase of 12.5%. For comparison, the successive increases in the ceiling in last October and January resulted in increases of 3.1% and 3.5%.

[3] In 2012, total lending of 9.7 billion euros was granted by the savings fund simply for financing the 105,000 social housing units.

[4] This objective corresponds to a campaign promise of the candidate Francois Hollande. It was recently downgraded: 120 000 housing financed per year until 2015 and 150,000 from 2016.

[5] For example, in 2012 Oséo and the FSI Strategic investment fund (Fonds stratégique d’investissement, FSI) received, respectively, 5.2 billion and 0.5 billion euros of resources from Livret A.

[6] The transfer was made ​​primarily to the LDD Sustainable development account (Livret de développement durable), whose outstandings grew by nearly 14 billion euros in October 2012 following the doubling of the ceiling.

[7] While the commission rate should converge by 2022 to 0.50% for all the distributing institutions, in 2011 it was 0.37% for new distributors and 0.53% for traditional distributors (CDC, 2012).


When Brazil’s youth dream of something besides football…

By Christine Rifflart

The rise in public transport prices had barely been in force for two weeks when this lit the fire of revolt and led to a new twist in the so-called “Brazilian development model”. With its aspirations for high-quality public services (education, health, transport, etc.), the new middle class that formed during the last decade is claiming its rights and reminding the government that the money put up to host major sports events (2014 World Cup, 2016 Olympics) should not be spent to the detriment of other priorities, especially when growth has ceased and budget constraints demand savings.

Over the years, Brazil’s growth accelerated from 2.5% per year in the 1980s and 1990s to almost 4% between 2001 and 2011. More importantly, for the first time the growth benefited a population that had traditionally been left out. Up to then, the slow growth of per capita income had gone hand in hand with rising inequality (the Gini coefficient for the period, at over 0.6, is one of the highest in the world) and an increase in poverty rates, which exceeded 40% during the 1980s. As hyperinflation was finally defeated by the 1994 “Plan Real”, growth resumed but remained fragile due to the series of external shocks that have hit the country (impact of the Asian crisis of 1997 and the Argentine crisis of 2001).

IMG1_Post-CR_English


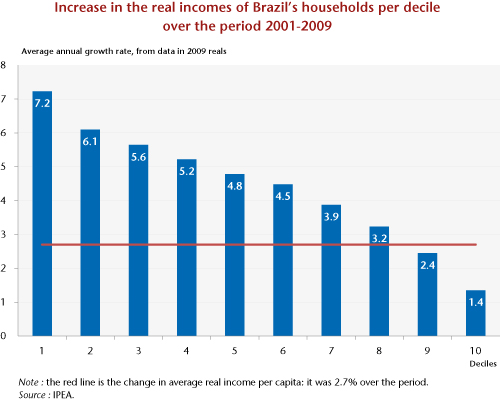
Lula’s accession to the presidency on 1 January 2003 marked a real turning point in this growth dynamic (Figure 1). While continuing the liberal orthodoxy of his predecessor F. H. Cardoso with respect to macro-economic policy and financial stability (unlike Argentina, for example), the new government took advantage of the renewed growth to better distribute the country’s wealth and to try to eradicate poverty. According to household surveys, real household income grew in local currency by 2.7% per year between 2001 and 2009, and the poverty rate fell by almost 15 percentage points to 21.4% of the population by the end of the period. In addition, the real income of the first eight deciles, especially the poorest 20% of the population, has increased much faster than the average income (Figure 2). Ultimately, 29 million Brazilians have joined the ranks of the new middle class, which now numbers 94.9 million (50.5% of the population), while the upper income class has welcomed 6.6 million additional Brazilians (and now represents 10.6% of the population). In contrast, the ranks of the poor decreased by 23 million, to 73.2 million in 2009. In terms of income, the new middle class now accounts for 46.2% of distributed income, more than the richest category, which saw its share decline to 44.1% [1].

IMG2_Post-CR_English

This new configuration of Brazilian society is changing consumption patterns and aspirations, particularly in terms of education, access to health care, infrastructure, etc. But while consumer spending has accelerated for 10 years (durables in particular) and stimulated private investment, the wind of democratization is posing a serious challenge to the government. For while the hike in public transport prices was quickly canceled, providing new infrastructure and improving the quality of public services in a country that is 15 times the size of France is not done in a day. In 2012, of 144 countries surveyed, the World Economic Forum (pp 116-117) ranked Brazil 107th for the quality of its infrastructure and 116th for the quality of its education system. The authorities must skillfully respond to the legitimate demands of the population, especially the youth [2].

The country has a solid basis for dealing with this and stimulating investment: a stable political and macroeconomic environment, sound public finances, external debt below 15% of GDP, abundant foreign exchange reserves, the confidence of the financial markets and direct foreign investors, and of course varied and abundant natural resources in agriculture (soybeans, coffee, etc.), mining (iron ore, coal, zinc, bauxite, etc.) and energy (hydroelectricity, oil).

But many difficulties lie ahead. Currently, growth is lacking, and it is even running up against problems with production capacity. In 2012, growth came to only 0.9% (insufficient to increase per capita income) and, even though investment is recovering, the forecasts for 2013 have been regularly revised downwards to around 3%. At the same time, inflation is picking up, driven by strong pressure on the labour market (at 5.5%, the unemployment rate is very low), and since 2008 productivity has stagnated. Inflation, which hit 6.5% in May, is at the top of the range allowed by the monetary authorities. To meet the target of 4.5%, which would mean a reduction of more or less 2 percentage points, in April the central bank raised its key rate from 7.25% to 8%. Monetary policy is nevertheless still very accommodative – the difference between the interest rate and the inflation rate has never been so small – and the moderate growth should lead to calming the inflationary pressures. In addition, the relative support monetary policy is giving to the economy is being offset by a policy of continuing fiscal consolidation. Following a primary surplus of 2.4% of GDP in 2012, the goal for this year is to maintain this at 2.3%. The net public sector debt is continuing to decline: from 60% ten years ago to 43% in 2008, reaching 35% last April.

The virtual stagnation in growth has been due in particular to a serious problem with competitiveness, which undercut the country’s growth potential. In a lackluster international economy, higher production costs and a seemingly overvalued currency have resulted in a drop in export performance, a reluctance to invest, and greater recourse to imports. The current account balance deteriorated by 1 GDP point in one year, reaching 3% in April.

To deal with this supply-side problem, Brazil’s central bank is intervening more and more to counter the adverse effects of capital inflows – attracted by high interest rates – on the exchange rate, while the government is seeking to boost investment. The investment rate, which has been under 20% of GDP over the last 20 years and close to 15% between 1996 and 2006, is structurally insufficient to lead the economy back onto a path of virtuous growth. For comparison, the investment rate over the past five years has been 44% in China, 38% in India and 24% in Russia. To lift Brazil’s investment rate towards a target of around 23%-25​​%, in 2007 the government introduced a “​​growth acceleration programme” (PAC), based on the implementation of major infrastructure projects.

In four years, public investment rose from 1.6% of GDP to 3.3%. The year 2011 saw the launch of the second phase of the PAC, which is slated to receive a budget of 1% of GDP per year for 4 years. There are also other investment programmes whose benefits, though disappointing in 2012, should still help resolve some of the problems. But the efforts being made are still insufficient. According to a 2010 study by Morgan Stanley [3], Brazil would need to invest 6 to 8% of its GDP in infrastructure every year for 20 years to catch up with the level of the infrastructure in South Korea, and 4% to catch that of Chile, the benchmark in the field in South America!

By improving the productive supply and by stimulating demand through increased public investment, the authorities’ objective is therefore to make up some of the delay built up from the past. But is it possible to carry out large-scale investment projects while simultaneously pursuing a policy of debt reduction when net public debt is close to 35% of GDP? The authorities should speed up the reform process to spur private investment, in particular by promoting the development of a national long-term savings programme (pension reform, etc.) while stimulating financial intermediation, which goes hand in hand with this.

The volume of loans granted by the financial sector to the non-financial sector represented only 54.7% of GDP in May. A little less than half of these are earmarked loans (rural credit, National Development Bank, etc.) at heavily subsidized interest rates (0.5% in real terms against 12% for non-subsidized loans to business, and 0.2% against 27.7% respectively for individuals). But the state must also reform a cumbersome and corrupt government.

Brazil has been an emerging country for over four decades. With an income of 11,500 dollars (PPP) per capita, it is time that this great country reaches adulthood by providing developed country quality standards for its public services and by refocusing its new development model on its new middle class, whose needs are still going unmet.


[1]See The Agenda of the New Middle Class | Portal FGV on the site of the Fondation Gétulio Vargas.

[2]http://www.oecd.org/eco/outlook/48930900.pdf

[3]See the study by Morgan Stanley Paving the way, 2010.


Vertical networks or clusters: what tool for industrial policy?

By Jean-Luc Gaffard

The concept of a “vertical network” [filière] is back in the spotlight and is playing the role of an instrument of the new industrial policy. A working document of the Fabrique de l’Industrie [Manufacturing Industry], ‘What use are ‘vertical networks’?” (Bidet-Mayer and Tubal, 2013) recognizes that the concept has the virtue of helping to identify good practices and develop their application in relationships between businesses and between business and government. However, the same paper concludes by questioning the merits of a concept that emphasizes an approach to industrial organization that is more technical than entrepreneurial.

Our purpose here is to explore this issue and to challenge the relevance of the “vertical network” concept and to advocate instead the notion of a “cluster”, which seems to correspond better to the need – for industrial policy – to recognize the leading role of the company in making strategic decisions.

The “vertical network”: a simplistic notion

In its old but strict sense, a “vertical network” consists of all or part of the successive stages of production, ranging from raw materials to the final product. This chain of products extends from upstream to downstream and is composed of technical relationships, which are identifiable based on technical coefficients of production. These are subsets of input-output tables that are characterized by the existence of a high level of spill-over or dominance effects that stem from the fact that the concentration of relationships is denser in some industries than in others (Mougeot, Auray and Duru, 1977).

Defined like this, a “vertical network” obviously says nothing about industrial organization per se, that is to say, about how firms set the boundaries for their activities. The companies concerned may choose to integrate the different stages in a vertical network or on the contrary focus on one stage and build pure market relations both upstream and downstream. They can also choose to form a relationship that could be described as a hybrid, based on medium-term contractual relationships both upstream and downstream.

The organizational decision takes place in a specific technical context, based on a comparison between the costs of operating through the market, through contracts or through internal transactions (Coase, 1937; Williamson, 1975). The technical features are covered over by the transaction costs and have limited relevance. The specific characteristics of the assets, which have a technical dimension, are taken into account in making the choice, but primarily because of the possibility for opportunistic behaviour (hostage-taking) that it permits.

The designation of a thusly defined “vertical network” as a tool of industrial policy, based on a certain stability of technical relations, creates an obstacle to innovation, whose major characteristic is to upset linkages within the vertical network and thus its very structure. In fact, the use of the “vertical network” concept really holds interest only for a short-term perspective, when it comes to measuring the impact of the transmission of cyclical fluctuations within a technically stable, productive structure (Mougeot, Auray and Duru, 1977).

The industrial policy measures that flow from this may affect how companies define the scope of their activities by affecting transaction costs. One example is the rules governing the relationships between contractors and subcontractors. But their effects are somewhat unclear with respect to the expected impact on the innovative capacity of the firms concerned.

The simplicity of the concept of a vertical network, together with its limitations, make the way that the concept is used (1) dangerous, if the fixed nature of the technique is taken literally (as has been the case in the past), and (2) ambiguous, if it is understood as dealing with the technical and organizational changes inherent in a market economy. As evidence of this ambiguity, consider a list of “vertical networks” today, which refer to objects such as cars, trains and planes; to luxury items whose most common feature is that they are aimed at a very rich clientele; to generic technologies such as information and communication technology; and to social issues such as health care and the ecological transition, not to mention the mishmash constituted by the consumer goods industry.

While the notion of a vertical network, that is to say, a group of industries that are technically related, has to some extent fallen into disuse since the 1980s, it is precisely because strategic business decisions are far from being dominated by technology, and a frozen state of technology in particular. The structuring of the industrial fabric is constantly changing as a result of the choices and constraints that determine them. In other words, industries are more the result of processes of innovation than of technical frameworks that supposedly control strategic choices.

It is not surprising, then, that industrial policy in the narrow sense of direct aid to companies in specific sectors has itself fallen into disuse and made room for policies on competition and regulation that are designed as efforts to move closer to a state of full competition.

The company: the essential reference

This observation does not mean that intra- and inter-vertical network relations do not matter and that all that counts are market incentives. Companies are not islands of planned coordination in a sea of ??market relations. They come to agreements about technology, distribution and marketing and develop subcontracting relationships and create joint ventures (Richardson, 1972). There is a major reason for this. To invest, a company has a need for coordination that cannot be met simply by the competitive market, but rather involves the emergence of forms of cooperation that reflect membership in a particular group. This company is characterized by its mobility, which leads it to introduce new products or even to change vertical network, thereby upsetting the relationships it has formed with others, but always along a trajectory that is determined by its core competencies.

Generally speaking, companies interact and have to solve difficulties in coordination arising from a lack of information. This is not so much a lack of technical information as a lack of information about market conditions, meaning the configuration of demand but also of competing and complementary suppliers (Richardson, 1960).

In fact, companies face two deadlines: a deadline for the gestation of irreversible investments, including investments in intangibles, and a deadline for acquiring market information. To deal with this and decide how to invest effectively, companies need to have a certain degree of confidence about the levels of competing investments and of complementary investments. The coordination required is not assured solely by market signals or, more precisely, by price signals alone. This also demands that cooperative relationships between companies complement their competitive relations (Richardson, 1960). These relationships constitute business networks for which the qualification of a “vertical network” is undoubtedly too narrow, even if technical proximities or complementarities do play a role. Belonging to a group characterized by having broadly similar skills or qualifications, rather than to a vertical network or business sector, is related to these relationships which secure the investments of each group member.

Companies seeking to innovate do not mainly face the existence of entry barriers (due to the price or investment behaviour of the established companies) or barriers to business creation. They have to deal in particular with the existence of barriers to growth that are related to their ability to be mobile (Caves and Porter, 1977). It is obviously difficult for companies to enter new business fields or to increase their size significantly. They are successful in attaining new size thresholds whenever they can acquire new managerial capabilities and ensure control of their capital. They enter into a new activity, possibly one that is quite different from their current activity in terms of the markets served, only so long as the technical and managerial skills in one business are useful in the other. Thus business groups come into being that are organized around similar or complementary skills, which transcend divisions into industries or sectors. These groups are the arenas where competition is carried out. Their very nature limits, or even thwarts, the development of an oligopolistic consensus. Because of their structural similarities, each group member responds in the same way to internal and external disturbances and anticipates the reactions of the others with a good deal of accuracy (Caves and Porter, 1977). A sort of coordination and mutual dependence thus develops within each group.

Based on this dual observation of the need for both coordination and mobility, it is clear that an industrial fabric is complex and can only with difficulty be reduced to “vertical networks” in the original meaning. Industrial policy is thereby inevitably affected, as it cannot be reduced to direct aid to firms, sectors or even technologies, nor to the application of rules on supposedly perfect competition.

Clusters: a suitable response

The nature of the productive system requires a horizontal industrial policy, which involves in particular subsidizing R&D and occupational training, but which makes sense only if this type of aid is conditional on the achievement of the objective of business mobility and of vertical as well as horizontal cooperation between companies.

It is with regard to this objective that the creation and development of clusters should be preferred, this being understood to mean groups or networks of companies and institutional structures that, while certainly having a geographical dimension, cannot necessarily be reduced to a strictly defined territory. A cluster is primarily a tool that aims to develop both voluntary cooperation between companies and a network of expertise. Its configuration is determined by the companies. The capacity building that arises from this organizational network nourishes a capillary type of action and the progressive entry of the individual members into new fields of activity.

Logically speaking, the initiative for these clusters should come from the companies themselves, with the government’s role being to encourage them, specifically by making its aid contingent on the reality of the cooperation achieved. Ensuring that there is genuine cooperation requires that public funding be conditional on the contribution of private funds. The method of governance must recognize the pre-eminent role of the firms in the industry. It is this feature that has underpinned the success of German industry – it is, to say the least, risky to chalk this success up to competitiveness gains generated by labour market reform (Duval, 2013).

In this light, there should be nothing surprising about the successes and failures of industrial policy. When these configurations have the characteristics of clusters in the sense used here, whether this involves aerospace, automotive or railway, the mechanisms implemented have allowed for credible projects that have promoted competitiveness. When the supposed industries are loosely or not at all structured and bear no relationship to clusters, the failures are obvious, because there are no eligible projects under existing public procedures and in particular because of the weak involvement of small and medium-sized enterprises in collaborative projects.

The fact that the vertical networks adopted cover almost every industry forbids, moreover, any real discrimination between the forms of industrial organization. There is thus a very real risk that public funds will be wasted. Some groups, who are accustomed to dealing with the government, will capture aid for projects that they would have carried out anyway, while at the same time companies that are engaged in innovative activities will not win any support, due to failing to fit the pre-defined framework.

Once again on the question of company size

There is a functional relationship between organizational efficiency and the growth rate, with the first falling when the second rises beyond a certain threshold (Richardson, 1964). The exploitation of new investment opportunities normally goes to companies that have the most suitable production experience, business contacts and marketing skills. These capabilities are a matter of degree. The degree of organizational constraint will depend not only on the growth rate but also on the direction in which the expansion takes place. This will also depend on the extent to which the company concerned can acquire the skills, including managerial, required to be mobile without incurring excessive costs (Richardson, 1964). A cluster type organization will be able to help.

The cluster is a place for exchanges and skills transfers that facilitate the entry of firms into new fields of activity, even if only geographical, which should enable the smaller ones to grow in size. The cluster organization can also promote mechanisms that facilitate the access by small firms to the financing required for investment, while at the same time allowing them to retain control of their capital, and thus their identity.

By way of a conclusion

As is clear, industrial policy should not amount to planning based on a purely technical approach to industrial organization, the kind captured in the “vertical network” concept, which would make it hostage to local and national lobbies. Nor should it be reduced to regulatory and competition policies designed for a virtual world where the only relations among companies are market relations. It must be understood as a way to stimulate the creation and development of clusters designed as operational networks of expertise, whose governance must be ensured under conditions that favour entrepreneurial decisions, and not bureaucratic ones.


Bibliography

Bidet-Mayer, T. and L. Toubal (2013): “A quoi servent les filières?” [What’s the use of “industries”], Working document, La Fabrique de l’Industrie.

http://www.la-fabrique.fr/Chantier/a-quoi-servent-les-filieres-document-de-travail

Duval, G. (2013): Made in Germany: le modèle allemand au delà du mythe, Paris: Le Seuil.

Mougeot M., Auray J.-P. and G. Duru (1977): La structure productive française, Paris: Economica.

Richardson, G.B. (1960): Information and Investment, Oxford: Clarendon Press (Reed. 1990).

Williamson, 0. (1975): Markets and Hierarchies, Analysis and Anti-Trust Implications, New York: Free Press.


Croatia in the European Union: an entry without fanfare

By Céline Antonin and Sandrine Levasseur

On 1 July 2013, ten years after filing its application to join the European Union, Croatia will officially become the 28th member state of the EU and the second member country from former Yugoslavia. Given the country’s size (0.33% of the GDP of the EU-28) and the political consensus on its membership, Croatia’s accession should pass relatively unnoticed. However, there are challenges posed by its entry. Indeed, at a time when the European Union is going through the worst crisis in its history, legitimate questions can be raised about whether Croatia is joining prematurely, particularly as it is experiencing its fifth successive year of recession. The latest OFCE Note (no. 27, 26 June 2013) reviews two of the country’s main weaknesses: first, a lack of competitiveness, and second, a level of corruption that is still far too high to guarantee steady and sustainable growth.

With 4.3 million inhabitants, Croatia initially experienced a period of strong economic growth up to 2008, based on the strength of its tourist industry and on consumption that was largely underpinned by lending from foreign capital. The crisis revealed, yet again, the limitations of this development model and highlighted the country’s structural weaknesses: a high level of dependence on foreign capital, the vulnerability of a system of (quasi) fixed exchange rates, an unfavourable environment for investment and wide-scale tax evasion.

Even though negotiations thankfully addressed some of these problems, others are still unresolved. For instance, with respect to the economy, the domestic market is still not open enough to competition, with the result that the country suffers from a lack of competitiveness. At the legal level, the progress made in the fight against corruption, tax evasion and the underground economy has been woefully inadequate, depriving the country of the foundations for robust growth. Following on the heels of Romania and Bulgaria, the entry of Croatia may unfortunately endorse the idea that curbing corruption is not a prerequisite for joining the EU. In view of the repeated institutional crises that have hit the European Union since 2009 and widespread Euroscepticism, it is now urgent for the EU to makes its priority deepening rather than widening.


Pensions: the Moreau report’s poor compromise

By Henri Sterdyniak

Under pressure from the financial markets and Europe’s institutions, the government felt obliged to present a new pension reform in 2013. However, reducing the level of pensions should not now be a priority for French economic policy: it is much more urgent to re-establish satisfactory growth, reform the euro zone’s macroeconomic strategy, and give a new boost to France’s industrial policy as part of an ecological transition. Establishing a committee of senior officials and experts is a common practice that is used these days to depoliticize economic and social choices and distance them from democratic debate. In this respect, the Moreau report, released on 14 June 2013, seems like a bad compromise. Although it does not call into question the public pension system, it weakens it and does not give itself the means to ensure the system’s social viability.

Do the social security accounts have to be balanced during a depression?

The deficit in the pension schemes in 2013 was mainly due to the depth of the recession, which has reduced the level of employment by about 5%, causing a loss of about 12 billion euros in funding for the pension schemes. The central objective of Europe’s economic policy should be to recover the jobs lost. Unfortunately, the Moreau report proposes continuing the strategy of a race to the bottom that is being implemented in Europe and France: “the pension schemes must contribute to restoring the public accounts and to France’s international credibility” (page 82). The report forgets that lower pensions lead to a decline in consumption, and thus in GDP, and to lower tax revenues and social security contributions, especially since all the euro zone countries are doing the same thing.

The report recommends reducing the deficit in the pension system relatively quickly by increasing the taxes paid by retirees. It adopts several well-known proposals uncritically. It would align the rates of pensioners’ CSG wealth tax with those of the employed. At one time, unlike employees, pensioners did not pay health insurance contributions. They have been hit by the establishment and then increase in the CSG tax. They already pay an additional contribution of 1% on their supplementary pensions. They are suffering from the retreat of the universal health scheme in favour of top-up health insurance. Increasing their CSG rate from 6.6% to 7.5% – the same as for employees – would bring in 1.8 billion euros. But shouldn’t it be necessary in exchange to eliminate the 1% contribution on supplementary pensions and make their top-up health insurance premiums (which are not paid by the companies) deductible?

Pensioners are entitled, like employees, to a 10% allowance for business expenses, but with a much lower ceiling. Even for employees, this allowance is much higher than actual business expenses; it offsets to some extent the possibilities of tax evasion by non-employees. The removal of the allowance would lead to 3.2 billion euros more in tax revenue to the state and a 1.8 billion reduction in certain benefits, linked to the amount of taxable income. Retirees would lose 2% of their purchasing power. But it is hard to see how this 5 billion would make its way into the coffers of the pension programmes.

Taxing pension family benefits (which would yield 0.9 billion) is certainly more justifiable, but again it is unclear how and why the product of this tax would go to the pension funds, especially as family benefits are the responsibility of the CNAF (National family benefits fund).

On the other hand, with regard to increasing contributions the report is very timid in at best proposing an increase of 0.1 percentage point per year for 4 years, i.e. ultimately 1.6 billion euros in employee contributions and 1.6 billion in employer contributions.

Most importantly, the report intends to increase the highest pensions (those who pay the full rate of CSG tax) only at the rate of inflation: 1.2 points for 3 years, thereby hitting them with a reduction of 3.6% in their purchasing power. Pensions subject to the reduced rate of CSG would lose only 1.5%. The lowest pensions would be spared. While this disparity in efforts may seem justified, the reliability of the public pension system would be seriously undermined. How can we be sure that this de-indexation will last only three years, that it will not become a more or less permanent management tool, which would especially hit older pensioners whose standard of living is already low? As the pensions received by a retiree are not all currently centralized, it is difficult to have the indexation of pensions vary in accordance with their level. The solution advocated by the report – to take into account the situation of the pensioner vis-à-vis the CSG – is hard to manage; making someone’s pension level depend on their family’s tax situation is just not justifiable. Pensions are a social right, a return on the contributions paid in, and not a tool for adjustments. How can we justify a 3.6% decline in the purchasing power of part of the population while GDP per capita is expected to continue to rise? Should the purchasing power of pensioners be cut when it has not benefited from an increase since 1983, even during periods of wage growth? Respect for the implicit social contract that underpins the pension system means that pensioners should make the same efforts as employees, no more, no less.

Furthermore, in times of economic recession the refrain that efforts need to be equitably distributed is dangerous. If everyone makes an effort by accepting less revenue and then reducing their expenditure, the inevitable result will be a drop in overall consumption, which, given spare production capacity, will be accompanied by a decline in investment and thus in GDP.

Guaranteeing a fall in pensions

In the medium term, the report’s main concern is to ensure a decline in the relative level of pensions. Indeed, because of the Balladur reform, since 1993 wages recognized in the general pension scheme have been re-valued based on prices, and not on the average wage. The replacement rate (the ratio of the first pension payment to final salary) falls in line with strong increases in the average wage: at one time the pension system’s maximum replacement rate was 50%, but this drops to 41.5% if real wages rise by 1.5% per year, but only to 47% if they rise by 0.5% per year. The mechanism introduced will lead to lowering the average level of pensions by 31% if the real wage increases by 1.5% per year, by 12% if it grows by 0.5% per year or by 0% if it stagnates. However, in recent years, wages have been rising by only 0.5% per year. The relative level of pensions might then recover. It is necessary therefore to increase wages to reduce the relative level of pensions.

The committee of experts gathered around Mrs. Moreau have therefore made two alternative proposals:

  • – Either the wages used will be re-valued only as: price + (real wages less 1.5%), which means that, regardless of the wage increase, the maximum replacement rate for general pensions would fall to 41.5%. The relative decline in pensions would therefore be definitively consolidated. On the technical side, the increase in wages recorded will become a tool for adjustment, whereas, objectively, it should be used to calculate the average wage over the career; the oldest wages would be sharply devalued. However, the report acknowledges (page 107) that the current level of pensions corresponds to parity in living standards between active employees and pensioners, and that the proposed change would lead eventually to lowering the standard of living for retirees by 13%. Nevertheless, it considers that “this development is acceptable”. Is this a judgment that should be made by the experts or by the citizens? Moreover, it neglects that this loss would come on top of the impact of the tax reforms and de-indexation that have also been recommended.
  • – Or, every year a committee of experts would propose a reduction in the level of the pensions to be paid based on a demographic factor that would ensure the system is balanced. In addition to the fact that this would be another blow to democracy (isn’t it up to the citizens to arbitrate between pension levels and contribution rates?) and to social democracy (the social partners would merely be consulted), and employees would have no guarantee of the future level of their pension, especially given the memory of the precedent set by the appointment of an expert group for the minimum wage (the SMIC), which was fiercely opposed to any increase.

Lengthening the contributions period

The Moreau report calls for further lengthening the period of contribution payments required based on the principles of the 2003 Act (extending the contribution period by two years for every three year increase in life expectancy at age 60). The required contribution period would then be 42 years for the 1962 cohort (2024), 43 years for the 1975 cohort (2037), and 44 years for the 1989 cohort (in 2051). As the average age when vesting begins is currently 22 years, this would lead to an average retirement age of 65 in 2037 and 66 in 2051. This announcement is certainly designed to reassure the European Commission and the financial markets, but it leads above all to worrying the younger generations and reinforcing their fear that they will never be able to retire.

Is it really necessary to announce a decision for the next 25 years without knowing what the situation will be in 2037 or 2051 with respect to the labour market, job needs, social desires or environmental constraints? Eventually, like all the developed countries France cannot escape the need to revise its growth model. Is it really necessary to do everything possible to increase production and private sector employment at a time when ecological constraints should be pushing us to decrease material output? Maintaining the possibility of a period of active retirement in good health is a reasonable use of productivity gains. Reform should not go beyond a retirement age of 62 years and a required contribution period of 42 years. So if the “long career” approach is maintained, people who start work at age 18 can retire at 60, and those who start at age 23 will stay on until 65. But working conditions and career development programmes need to be overhauled so that everyone can actually stay in work until those ages. This also implies that young people seeking their first job receive unemployment benefits, and that the youthful years of precarious employment are validated.

Taking the arduous character of work into account

The convergence of public, supplementary and private pension programmes likewise involves taking into account how arduous jobs are, by distinguishing between professions that are difficult to exercise after a certain age, meaning some kind of mid-term conversion is necessary, and jobs that are too tough, which can reduce life expectancy and thus should be phased out. For those who still have to do such jobs, periods of heavy work should give rise to possible bonus contribution periods and reductions in the age requirements. Common criteria should be applied in all the pension systems. In offering only one year’s bonus for 30 years of hard labor, the Moreau report does not go far enough. This is almost insulting and makes it impossible to open up negotiations on a plan to align the different systems.

What is to be done?

Whereas the COR report declared only a limited deficit (1% of GDP in 2040), the Moreau report proposes inflicting a triple penalty on future pensioners: de-indexation, a lower guaranteed replacement rate and the automatic extension of the contributions period required. This is no way to reassure the young generations or to highlight the advantages of the old-age pension system.

Pension reform is not a priority for the year 2013. In the short term, concern should be focused not on the financial imbalances in the regimes induced by the crisis but mainly on getting out of the depression. A strategy of a race to the bottom economically and socially, which is what de-indexation would lead to, must be avoided.

In the medium term, in order to convince young people that they will indeed enjoy a satisfying retirement, the goal should be to stabilize the pension / retirement ratio at close to its current level. The State and the unions must agree on target levels for the net replacement rate for normal careers: 85% for the minimum wage level; 75% for below the social security ceiling (3000 euros per month); and 50% for one to two times that ceiling.

To guarantee the pay-as-you-go pension system, the government and the unions must state clearly that a gradual increase in contributions will be required to bring the system into equilibrium, if necessary, once a strategy of extending the length of careers has been implemented at the company level that corresponds to the state of the labour market and actual workforce needs.


Reforming the conjugal quotient

By Guillaume Allègre and Hélène Périvier

As part of a review of family benefit programmes (the motivations for which are in any case debatable), the government has announced plans to reduce the cap on the family quotient benefit in the calculation of income tax (IR) from 2014. The tax benefit associated with the presence of dependent children in the household will be reduced from 2000 to 1500 euros per half share. Opening discussion on the family quotient should provide an opportunity for a more general review of how the family is taken into account in the calculation of income tax, and in particular the taxation of couples.

How are couples taxed today?

In France, joint taxation is mandatory for married couples and civil partners (and their children), who thus form part of one and the same household. It is assumed that members of a household pool their resources fully, regardless of who actually contributes them. By assigning two tax shares to these couples, the progressive tax scale is applied to the couple’s average revenue [(R1 + R2) / 2]. When the two spouses earn similar incomes, the marital quotient does not provide any particular advantage. In contrast, when the two incomes are very unequal, joint taxation provides a tax advantage over separate taxation.

In some configurations, separate taxation is more advantageous than joint taxation; this is due partly to the particular way that the employment bonus and tax reduction [1] operates, and to the fact that separate taxation can be used to optimize the allocation of the children between the two tax households, which by construction does not permit joint taxation. Tax optimization is complex, because it is relatively opaque to the average taxpayer. Nevertheless, in most cases, marriage (or a “PACS” civil partnership) provides a tax benefit: 60% of married couples and civil partners pay less tax than if they were taxed separately, with an average annual gain of 1840 euros, while 21% would benefit from separate taxation, which would save them an average of 370 euros (Eidelman, 2013).

Why grant this benefit just to married couples and civil partners?

The marital quotient is based on the principle that resources are fully pooled by the couple. The private contract agreed between two people through marriage or a PACS constitutes a “guarantee” of this sharing. In addition, the marriage contract is subject to a maintenance obligation between spouses, which binds them beyond the wedding to share part of their resources. However, the Civil Code does not link “marriage” to the “full pooling” of resources between spouses. Article 214 of the Civil Code provides that spouses shall contribute towards the expenses of the marriage “in proportion to their respective abilities”, which amounts to recognizing that the spouses’ abilities to contribute may be unequal. Since 1985, Article 223 has established the principle of the free enjoyment of earned income, which reinforces the idea that marriage does not mean that the spouses share the same standard of living: “each spouse is free to practice a profession, to collect earnings and wages and to spend them after paying the costs of the marriage”. The professional autonomy of the spouses and the right to dispose of their wages and salaries are fully recognized in the Civil Code, whereas the Tax Code is limited to an overview of the couple’s income and expenditures.

In addition, there is some dissonance between the social and the tax treatment of couples. The amount of the RSA benefit [income support] paid to a couple is the same whether they are married or common-law partners. As for the increased RSA paid to single mothers with children, being single means living without a spouse, including a common law partner. Cohabitation is a situation recognized by the social system as involving the pooling of resources, but not by the tax system.

Do couples actually pool their resources?

Empirical studies show that while married couples tend to actually pool all their income more than do common-law partners, this is not the case of everyone: in 2010, 74% of married couples reported that they pooled all their resources, but only 30% of PACS partners and 37% of common-law couples. Actual practice depends greatly on what there is to share: while 72% of couples in the lowest income quartile report pooling their resources fully, this is the case for only 58% of couples in the highest quartile (Ponthieux, 2012). The higher the level of resources, the less the couple pools them. Complete pooling is thus not as widespread as assumed: spouses do not necessarily share exactly the same standard of living.

Capacity to contribute and number of tax shares allocated

The tax system recognizes that resources are pooled among married couples and civil partners, and assigns them two tax shares. The allocation of these tax shares is based on the principle of ability to pay, which must be taken into account to be consistent with the principle of equality before taxation: in other words, the objective is to tax the standard of living rather than income per se. For a single person and a couple with the same incomes, the singleton has a higher standard of living than the couple, but due to the benefits of married life it is not twice as high. To compare the living standards of households of different sizes, equivalence scales have been estimated (Hourriez and Olier, 1997). The INSEE allocates a 1.5 share (or consumption unit) to couples and a 1 share to single people: so according to this scale, a couple with a disposable income of 3000 euros has the same standard of living as a single person with an income of 2000 euros. However, the marital quotient assigns two shares to married couples but one to the single person. It underestimates by 33% the standard of living of couples relative to single people, and therefore they are not taxed on their actual ability to contribute.

Moreover, once again there is an inconsistency between the treatment of couples by social policy and by fiscal policy: social security minima take into account the economies of scale associated with married life in accordance with the equivalence scales. The base RSA (RSA socle) received by a couple (725 euros) is 1.5 times greater than that received by a single person (483 euros). There is an asymmetry in the treatment of spouses depending on whether they belong to the top of the income scale and are subject to income tax, or to the bottom of the income scale and receive means-tested social benefits.

What family norms are encapsulated in the marital quotient?

The marital quotient was designed in 1945 in accordance with a certain family norm, that of Monsieur Gagnepain and Madame Aufoyer [“Mr Breadwinner and Ms Housewife”]. It contributed together  with other family programmes to encouraging this type of family organization, i.e. the one deemed desirable. Until 1982, tax was based solely on the head of the family, namely the man, with the woman viewed as the man’s responsibility. But far from being a burden on her husband, the wife produced a free service through the domestic work she performed. This home production (the care and education of children, cleaning, cooking, etc.) has an economic value that is not taxed. Single earner couples are thus the big winners in this system, which gives them an advantage over dual earner couples, who must pay for outsourcing part of the household and family work.

In summary, the current joint taxation system leads to penalizing single persons and common-law couples compared to married couples and civil partners, and to penalizing dual-earner couples compared to single-earner couples. The very foundations of the system are unfavourable to the economic liberation of women.

What is to be done?

The real situation of families today is multiple (marriage, cohabitation, etc.) and in motion (divorce, remarriage or new partnerships, blended families); women’s activity has profoundly changed the situation in the field. While all couples do not pool their resources, some do, totally or partially, whether married or in common law unions. Should we take this into account? If yes, how should this be done in light of the multiplicity of forms of union and the way they constantly change? This is the challenge we face in reforming the family norms and principles that underpin the welfare state. Meanwhile, some changes and rebalancing could be achieved.

Currently, the benefit from joint taxation is not capped by law. It can go up to 19,000 euros per year (for incomes above 300,000 euros, an income level subject to the highest tax bracket) and even to almost 32,000 euros (for incomes above 1,000,000 euros) if you include the benefit of joint taxation for the exceptional contribution on very high incomes. For comparison, we note that the maximum amount of the increase in the RSA for a couple compared to a person living alone is 2900 euros per year. The ceiling on the family quotient (QF), which is clear, is 1500 euros per half share. A cap on the marital quotient of 3000 euros (twice the cap on the QF) would affect only the wealthiest 20% of households (income of over 55,000 euros per year for a single-earner couple with two children). At this income level, it is likely that the benefit from joint taxation is related to an inequality in income that is the result of specialization (full or not) between the spouses in market and non-market production or that resources are not fully shared between the partners.

Another complementary solution would be to leave it up to every couple to choose between a joint declaration and separate declarations, and in accordance with the consumption scales commonly used to accord the joint declaration only 1.5 shares instead of 2 as today. The tax authorities could calculate the most advantageous solution, as households do not always choose the right option for them.

A genuine reform requires starting a broader debate about taking family solidarity into account in the tax-benefit system. In the meantime, these solutions would rebalance the system and turn away from a norm that is contrary to gender equality. At a time when the government is looking for room for fiscal maneuvering, why prohibit changing the taxation of couples?


[1] A tax reduction [décote]is applied to the tax on households with a low gross tax (less than 960 euros). As the reduction is calculated per household and does not depend on the number of persons included in the household, it is relatively more favourable for singles than for couples. It helps ensure that single people working full time for the minimum wage are not taxable. For low-income earners, the reduction thus compensâtes the fact that single persons are penalized by the marital quotient. No similar mechanism is provided for high-income earners.


Competitiveness: danger zone!

By Céline Antonin, Christophe Blot, Sabine Le Bayon and Catherine Mathieu

The crisis affecting the euro zone is the result of macroeconomic and financial imbalances that developed during the 2000s. The European economies that have provoked doubt about the sustainability of their public finances (Spain, Portugal, Greece and Italy [1]) are those that ran up the highest current account deficits before the crisis and that saw sharp deteriorations in competitiveness between 2000 and 2007. Over that same period Germany gained competitiveness and built up growing surpluses, to such an extent that it has become a model to be emulated across the euro zone, and especially in the countries of southern Europe. Unit labor costs actually fell in Germany starting in 2003, at a time when moderate wage agreements were being agreed between trade unions and employers and the coalition government led by Gerhard Schröder was implementing a comprehensive programme of structural reform. This programme was designed to make the labour market [2] more flexible and reform the financing of social protection but also to restore competitiveness. The concept of competitiveness is nevertheless complex and reflects a number of factors (integration into the international division of production processes, development of a manufacturing network that boosts network effects and innovation, etc.), which also play an important role.

In addition, as is highlighted in a recent analysis by Eric Heyer, Germany’s structural reforms were accompanied by a broadly expansionary fiscal policy. Today, the incentive to improve competitiveness, strengthened by the implementation of improved monitoring of macroeconomic imbalances (see here), is part of a context marked by continued fiscal adjustment and high levels of unemployment. In these conditions, the implementation of structural reforms coupled with a hunt for gains in competitiveness could plunge the entire euro zone into a deflationary situation. In fact, Spain and Greece have already been experiencing deflation, and it is threatening other southern Europe countries, as we show in our latest forecast. This is mainly the result of the deep recession hitting these countries. But the process is also being directly fueled by reductions in public sector wages, as well as in the minimum wage (in the case of Greece). Moreover, some countries have cut unemployment benefits (Greece, Spain, Portugal) and simplified redundancy procedures (Italy, Greece, Portugal). Reducing job protection and simplifying dismissal procedures increases the likelihood of being unemployed. In a context of under-employment and sluggish demand, the result is further downward pressure on wages, thereby increasing the deflationary risks. Furthermore, there has also been an emphasis on decentralizing the wage bargaining process so that they are more in tune with business realities. This is leading to a loss of bargaining power on the part of trade unions and employees, which in turn is likely to strengthen downward pressure on real wages.

The euro zone countries are pursuing a non-cooperative strategy that is generating gains in market share mainly at the expense of other European trading partners. Thus since 2008 or 2009 Greece, Spain, Portugal and Ireland have improved their competitiveness relative to the other industrialized countries (see graph). The continuation of this strategy of reducing labor costs could plunge the euro zone into a deflationary spiral, as the countries losing market share seek in turn to regain competitiveness by reducing their own labour costs. Indeed, this non-cooperative strategy, initiated by Germany in the 2000s, has already contributed to the crisis in the euro zone (see the box on p.52 of the ILO report published in 2012). It is of course futile to hope that the continuation of this strategy will provide a solution to the current crisis. On the contrary, new problems will arise, since deflation [3] will make the process of reducing both public and private debt more expensive, since debt expressed in real terms will rise as prices fall: this will keep the euro zone in a state of recession.


[1] The Irish case is somewhat distinct, as the current account deficit seen in 2007 was due not to trade, but a shortfall in income.

[2] These reforms are examined in detail in a report by the Conseil d’analyse économique (no. 102). They are summarized in a special study La quête de la compétitivité ouvre la voie de la déflation (“The quest for competitiveness opens the door to deflation”).

[3] For a more comprehensive view of the dynamics of debt-driven deflation, see here.


A fiscal policy to promote structural reform – lessons from the German case

By Eric Heyer

“France should copy Germany’s reforms to thrive”, Gerhard Schröder entitled an opinion piece in the Financial Times on 5 June 2013. As for the European Commission (EC), its latest annual recommendations to the Member states, released on 29 May, seem to take a step back from its strategy of a rapid and synchronized return to balancing the public finances, which has been in place since 2010. The EU executive’s priority now seems to be implementation of structural reforms of the labour and services markets in the euro zone countries. These countries will of course continue to consolidate their public finances, but the EC has given them an extra year or two to do this. While, for example, France will further consolidate its accounts over the coming two years (the fiscal effort demanded of the French government by the EC comes to 0.8 percent of GDP, or 16 billion euros per year), it has been given another two years to bring its deficit below 3% of GDP (2015 instead of 2013). This change in course – or at least in tone – by the EC, which had emphasized the enactment of extreme austerity reforms, should be welcomed. However, it is important to consider whether the new environment, in particular the fiscal situation, will be favourable enough to ensure that the structural reforms are effective. An examination of the economic context in which Germany introduced its reforms in the early 2000s, which became a benchmark for the countries of southern Europe, provides some important lessons. While the purpose here is not to go into these reforms in depth, it is nevertheless useful to remember that they were enacted while the German economy had a substantial trade deficit (‑1.8 percent of GDP in 2000 against a surplus of 1.4 percent for France at that same time) and was considered a “low achiever” in Europe. These reforms led to a significant reduction in the share of wages in value added, boosting the margins of German business, and helped to quickly restore the competitiveness of the German economy: by 2005, Germany was once again generating a large trade surplus while France ran a deficit for the first time since 1991. The non-cooperative character of the the euro zone (OFCE, 2006) and the steep increases in Germany in poverty – (Heyer, 2012) and Figure 1 – and in wealth inequality (de Grauwe et Yi, 2013) were the hidden fruit of this strategy. Europe’s “low achievers” today are the southern European countries, and the pressure to take steps to boost competitiveness has shifted from Germany to France, Italy and Spain. Despite this parallel, the question remains: is the economic environment similar today? Figures 1 and 2 summarize the economic situation in Germany at the time the structural reforms were implemented. Two main points stand out:

  1. These reforms were carried out in a context of strong global growth: the world experienced average growth of over 4.7% per year in 2003-2006 (Figure 1).  By comparison, the figure for growth is likely to be less than 3% over the next two years;
  2. In addition, the fiscal situation of the German economy in the early 2000s was not good: in 2001, the general government deficit for Germany exceeded 3%, and came close to 4% in 2002, the year before the enactment of the first Hartz reform. Government debt then exceeded the threshold of 60% of GDP allowed by the Maastricht Treaty for the first time. Despite this poor fiscal performance – with public debt approaching 70% in 2005 – it is interesting to note that the German government continued to maintain a highly expansionary fiscal policy for as long as the reforms had not been completed: in the period 2003-2006, the fiscal impulse was positive at on average 0.7 GDP point each year (Figure 2). Thus, during this period the German government supported its structural reforms with a highly accommodative fiscal policy.

Thus not only was the structural reform of the labour market conducted under Schröder implemented in a very favourable economic environment (strong global growth and a strategy that differed from the other European countries), but it was also accompanied by a particularly accommodative fiscal policy, given in particular the poor state of Germany’s public finances. This situation differs greatly from contemporary conditions:

  1. Global growth is likely to be under 3% over the coming two years;
  2. The EC is asking a large number of European countries to implement the same structural reforms simultaneously, which in a highly integrated euro zone limits their effectiveness; and
  3. Despite the extra time being granted for deficit reduction, fiscal policy will remain very tight: as is indicated in Table 1, the fiscal impulses for France and Spain will still be very negative (-0.8 GDP point per year) as the structural reforms in these countries are being implemented.

So while the pressure to boost the competitiveness of the countries of southern Europe is similar to that facing Germany in the early 2000s, the external environment is less favourable and there is greater pressure to reduce the public debt. On this last point, the German example teaches us that it is difficult to juggle structural reforms to boost business competitiveness with efforts to reduce the public debt.


Monetary policy and property booms: dealing with the heterogeneity of the euro zone

By Christophe Blot and Fabien Labondance

The transmission of monetary policy to economic activity and inflation takes place through various channels whose role and importance depend largely on the structural characteristics of an economy. The dynamics of credit and property prices are at the heart of this process. There are multiple sources of heterogeneity between the countries of the euro zone, which raises questions about the effectiveness of monetary policy but also about the means to be used to reduce this heterogeneity.

The possible sources of heterogeneity between countries include the degree of concentration of the banking systems (i.e. more or fewer banks, and therefore more or less competition), the financing arrangements (i.e. fixed or variable rates), the maturity of household loans, their levels of debt, the proportion of households renting, and the costs of transactions on the housing market. The share of floating rate loans perfectly reflects these heterogeneities, as it is 91% in Spain, 67% in Ireland and 15% in Germany. In these conditions, the common monetary policy of the European Central Bank (ECB) has asymmetric effects on the euro zone countries, as is evidenced by the divergences in property prices in these countries. These asymmetries will then affect GDP growth, a phenomenon that has been observed both “before” and “after” the crisis. These issues are the subject of an article that we published in the OFCE’s Ville et Logement (Housing and the City) issue. We evaluated heterogeneity in the transmission of monetary policy to property prices in the euro zone by explicitly distinguishing two steps in the transmission channel, with each step potentially reflecting different sources of heterogeneity. The first describes the impact of the interest rates controlled by the ECB on the rates charged for property loans by the banks in each euro zone country. The second step involves the differentiated impact of these bank rates on property prices.

Our results confirm the existence of divergences in the transmission of monetary policy in the euro zone. Thus, for a constant interest rate set by the ECB at 2%, as was the case between 2003 and 2005, the estimates made ​​during the period preceding the crisis suggest that the long-term equilibrium rate applied respectively by Spanish banks and Irish banks would be 3.2% and 3.3%. In comparison, the equivalent rate in Germany would be 4.3%. Moreover, the higher rates in Spain and Ireland amplify this gap in nominal rates. We then show that the impact on bank rates of changes in the ECB’s key rate is, before the crisis, stronger in Spain and Ireland than it is in Germany (figure), which is related to differences in the share of loans made at floating rates in these countries. It should be noted that the transmission of monetary policy was severely disrupted during the crisis. The banks did not necessarily adjust supply and demand for credit by changing rates, but by tightening the conditions for granting loans. [1] Furthermore, estimates of the relationship between the rates charged by banks and property prices suggest a high degree of heterogeneity within the euro zone. These various findings thus help to explain, at least partially, the divergences seen in property prices within the euro zone. The period during which the rate set by the ECB was low helped fuel the housing boom in Spain and Ireland. The tightening of monetary policy that took place after 2005 would also explain the more rapid adjustment in property prices observed in these two countries. Our estimates also suggest that property prices in these two countries are very sensitive to changes in economic and population growth. Property cycles cannot therefore be reduced to the effect of monetary policy.

To the extent that the recent crisis has its roots in the macroeconomic imbalances that developed in the euro zone, it is essential for the proper functioning of the European Union to reduce the sources of heterogeneity between the Member states. However, this is not necessarily the responsibility of monetary policy. First, it is not certain that the instrument of monetary policy, short-term interest rates, is the right tool to curb the development of financial bubbles. And second, the ECB conducts monetary policy for the euro zone as a whole by setting a single interest rate, which does not permit it to take into account the heterogeneities that characterize the Union. What is needed is to encourage the convergence of the banking and financial systems. In this respect, although the proposed banking union still raises many problems (see Maylis Avaro and Henri Sterdyniak), it may reduce heterogeneity. Another effective way to reduce asymmetry in the transmission of monetary policy is through the implementation of a centralized supervisory policy that the ECB could oversee. This would make it possible to strengthen the resilience of the financial system by adopting a means of regulating banking credit that could take into account the situation in each country in order to avoid the development of the bubbles that pose a threat to the countries and the stability of the monetary union (see CAE report no. 96 for more details).


[1] Kremp and Sevestre (2012) emphasize that the reduction in borrowing volumes is not due simply to the rationing of the supply of credit but that the recessionary context has also led to a reduction in demand.


The strange forecasts of the European Commission for 2014

By Mathieu Plane

The figures for French growth for 2014 published by the European Commission (EC) in its last report in May 2013 appear to reflect a relative consensus. Indeed, the Commission expects GDP to grow by 1.1% in 2014, which is relatively close to the forecasts by the OECD (1.3%) and the IMF (0.9%) (Table 1). However, these forecasts of broadly similar growth hide some substantial differences. First, in defining future fiscal policy, the Commission, unlike the other institutions, considers only the measures already approved. While the Commission’s growth forecasts for 2013 included the measures enacted by the Finance Act for 2013 (and therefore the austerity measures), the forecasts for 2014 do not include any forthcoming fiscal measure, even though according to the stability programme submitted to Brussels in April 2013 the government plans austerity measures amounting to 20 billion euros in 2014 (a fiscal impulse of -1 GDP point). The exercise carried out by the Commission for 2014 is thus closer to an economic framework than an actual forecast, as it fails to include the most likely fiscal policy for the year. As a result, the French government has no reason to rely on the Commission’s growth forecast for 2014 as it makes radically different assumptions about fiscal policy. But beyond this difference, there is also a problem with the overall coherence of the economic framework set out by the Commission for 2014. It is indeed difficult to understand how for 2014 the Commission can forecast an increase in the unemployment rate with a significantly worsened output gap and a positive fiscal impulse.

Overall, all the institutions share the idea that the output gap in France is currently very wide, lying somewhere between -3.4 percent of GDP (for the EC) and -4.3 percent (for the OECD) in 2013 (Table 1). Everyone thus believes that current GDP is very far from its long-term trajectory, and this deficit in activity should therefore lead, in the absence of an external shock or a constraint on fiscal and monetary policy, to a spontaneous catch-up in growth in the coming years. This should result in a growth rate that is higher than the potential, regardless of the latter’s value. So logically, if there is a neutral or positive fiscal stimulus, GDP growth should therefore be much greater than the trend potential. For the IMF, the negative fiscal impulse (-0.2 percent of GDP) is more than offset by the spontaneous catch-up of the economy, resulting in a slight closing of the output gap (0.2) in 2014. For the OECD, the strongly negative fiscal impulse (-0.7 percent of GDP) does not allow closure of the output gap, which continues to widen (-0.3), but less than the negative impact of the impulse due to the spontaneous process of catching up. In both these cases (OECD and IMF), the restrictive fiscal policy holds back growth but leads to an improvement in the public accounts in 2014 (0.5 percent of GDP for the OECD and 0.3 for the IMF).

As for the Commission, its budget forecasts include a positive fiscal impulse for France in 2014 (+0.4 GDP point). As we saw above, the Commission takes into account only the fiscal measures already approved that affect 2014. However, for 2014, if no new fiscal measures are taken, the tax burden should spontaneously decrease due to the fall between 2013 and 2014 in the yield of certain tax measures or the partial financing of other measures (such as the CICE Tax credit for competitiveness and jobs). This could of course result in a positive fiscal impulse in 2014. But despite this impact, which is similar to a stimulus policy (on a small scale), the closure of the output gap (0.1 percent of GDP) is less than the fiscal impulse. This suggests implicitly that fiscal policy has no effect on activity and especially that there is no spontaneous catch-up possible for the French economy despite the very large output gap. But it is not clear why this is the case. Suddenly, the government balance deteriorates in 2014 (-0.3 percent of GDP) and the unemployment rate rises by 0.3 percentage points (which may seem paradoxical with an output gap that doesn’t worsen). The French economy is thus losing on all fronts according to the major macroeconomic indicators.

In view of the potential growth, the output gaps and the fiscal impulses adopted by the Commission (the OECD and the IMF), and based on incorporating relatively standard assumptions (a short-term fiscal multiplier equal to 1 and spontaneous closure of the output gap in 5 years), one would have expected the Commission to go for growth in France in 2014 of 2.1% (1.7% for the OECD and 1.2% for the IMF), and thus a steep reduction in unemployment.

Paradoxically, we do not find this same logic in the Commission’s forecasts for Germany and the euro zone as a whole (Table 2). In the case of Germany, despite a slight deterioration in the output gap in 2013 (-1 GDP point), which would normally point to some spontaneous catch-up by the German economy in 2014, and an almost neutral fiscal impulse (0.1 GDP point), Germany’s growth in 2014 is expected to be 1.8%, thus permitting the output gap to close by 0.5 GDP point, resulting in a fall in the unemployment rate and a reduction in Germany’s public deficit in 2014.

In the case of the euro zone, we find the same scenario: a marginally positive fiscal impulse (0.2 percent of GDP) and a rapid reduction in the output gap (0.7 percent of GDP), which translates both into an improvement in the public accounts despite the positive fiscal impulse and a fall in the unemployment rate (even if we would have expected a greater reduction in the latter in light of the improvement in the output gap).

Given the potential growth, the output gaps and the fiscal impulses adopted for each country by the Commission, the forecast for 2014 could have been for growth of 2.1% in France, 1.6% in Germany and 1.3% for the euro zone.

Finally, why would France, despite a greater output gap than Germany and the euro zone and a stronger positive fiscal impulse, experience an increase in its unemployment rate in 2014 while the rate falls in the other countries? Should we interpret this as reflecting that it is a problem or even impossible for the Commission to include in a forecast that a policy without fiscal consolidation could lead to growth and reduce unemployment spontaneously in France?