By Bruno Ducoudré
Following on the heels of the IMF and the European Commission (EC), the OECD has also recently made a downward revision in its forecast for GDP growth in the euro zone in 2012 (-0.4%, against -0.1% in April 2012) and in 2013 (0.1%, against 0.9% in April 2012). In its latest forecasting exercise, the OECD says it now shares with the other international institutions (the IMF [i] and EC [ii]) the idea that the multipliers are currently high in the euro zone [iii]: the simultaneous implementation of fiscal austerity throughout the euro zone while the economy is already in trouble, combined with a European Central Bank that has very little leeway to cut its key interest rate further, is increasing the impact of the ongoing fiscal consolidation on economic activity.
The revision of the positioning of the three institutions poses two questions:
- – What are the main factors leading to the revision of the growth forecasts? Given the scale of the austerity measures being enacted in the euro zone, we can expect that the revised forecast of the fiscal impulses is a major determinant of the revisions to the growth forecasts. These revisions are, for example, the main factor explaining the OFCE’s revisions to its growth forecasts for France in 2012.
- – Is this change in discourse concretely reflected in an upward revision of the multipliers used in the forecasting exercises? These institutions do not generally specify the size of the multipliers used in their forecasting. An analysis of the revisions to the forecasts for the euro zone in 2012 and 2013 can, however, tell us the extent to which the multipliers have been revised upwards.
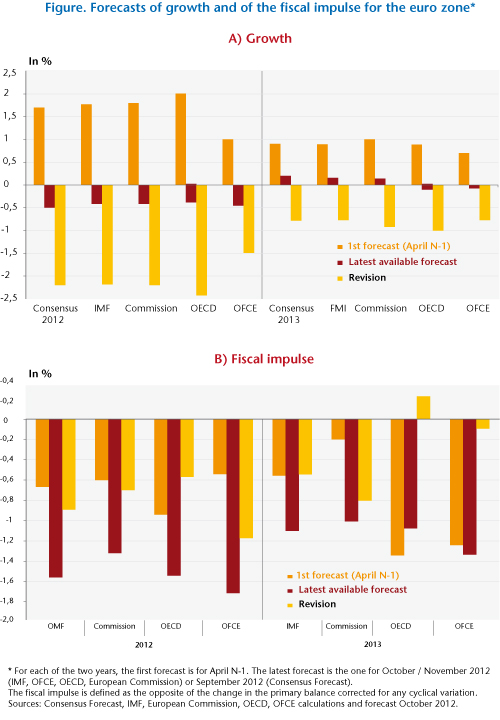
The following graph shows that between the forecast made in April of year N-1 for the euro zone and the latest available forecast for year N, the three institutions have revised their forecast sharply downward, by ‑2.3 points on average in 2012 and -0.9 point on average in 2013.
At the same time, the fiscal impulses have also been revised, from -0.6 GDP point for the OECD to -0.8 GDP point for the IMF for 2012, and by 0.8 point for the Commission to +0.2 point for the OECD in 2013, which explains some of the revisions in growth for these two years.
Comparatively speaking, for 2012 the OFCE is the institute that revised its growth forecast the least, but which changed its forecast for the fiscal impulse the most (-1.7 GDP points forecast in October 2012, against the forecast of -0.5 GDP point in April 2011, a revision of -1.2 points). In contrast, for 2013 the revision in the growth forecast is similar for all the institutions, but the revisions of the impulses are very different. These differences may thus arise in part from the revision of the multipliers.
The revisions of the growth forecasts ğ can be broken down into several terms:
- – A revision in the fiscal impulse IB, denoted ΔIB;
- – A revision in the multiplier k, denoted Δk, k0 being the initial multiplier and k1 the revised multiplier;
- – A revision of the spontaneous growth in the euro zone (excluding the impact of fiscal policy), of fiscal impulses outside the euro zone, etc.: Δe
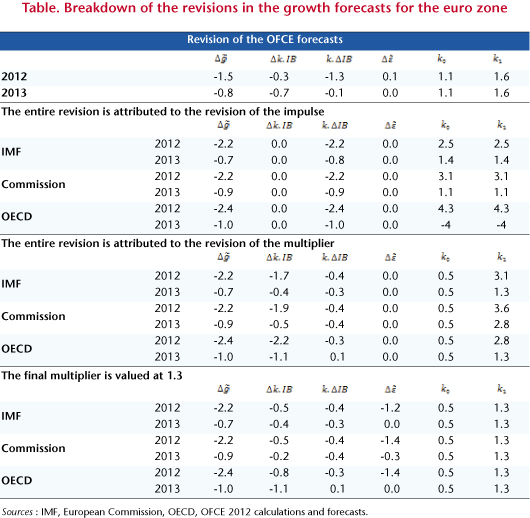
The revision of the OFCE forecast by -1.5 points for 2012 that took place between April 2011 and October 2012 breaks down as follows: ‑1.3 points from the revision of the fiscal impulses, and ‑0.3 point from the upward revision of the multiplier (table). The sum of the effects of the other sources of revision adds 0.1 percentage point growth in 2012 compared with the forecast made in April 2011. In contrast, the revision for 2013 is due mainly to the increase in the size of the multiplier.
As for the international institutions, these elements (size of the multiplier, spontaneous growth, etc.) are not all known to us, except for the fiscal impulses. There are a number of polar cases that can be used to infer an interval for the multipliers used in the forecasting. In addition, if it is mainly revisions of the fiscal impulse and revisions of the size of the multiplier that are the source of the revision of the growth forecasts, as a first approximation it can be assumed that Δe = 0. We can then calculate the implied multiplier for the case that the entirety of the revision is attributed to the revision of the fiscal impulses, and for the case that the revision is divided between the revision of the multiplier and the revision of the impulse.
Attributing the entirety of the revisions of the forecasts for 2012 to the revision of the impulses would imply very high initial multipliers, on the order of 2.5 for the IMF to 4.3 for the OECD (Table), which is not consistent with the IMF analysis (which evaluates the current multiplier at between 0.9 and 1.7). On the other hand, the order of magnitude of the inferred multipliers for the IMF (1.4) and the Commission (1.1) for the year 2013 seems closer to the current consensus, if we look at the current literature on the size of the multipliers.
The hypothesis could also be made that in the recent past the Commission, the OECD and the IMF based themselves on multipliers derived from DSGE models, which are generally low, on the order of 0.5 [1]. Adopting this value for the first forecasting exercise (April 2011 for the year 2012 and April 2012 for 2013), we can calculate an implicit multiplier such that the entirety of the revisions breaks down between the revision of the impulse and the revision of the multiplier. This multiplier would then be between 2.8 (OECD) and 3.6 (EC) for the year 2012, and between 1.3 (OECD and IMF) and 2.8 (EC) for 2013.
The revisions of the forecast for 2012 are not primarily drawn from a joint revision of the fiscal impulses and the size of the multipliers. A significant proportion of the revisions for growth also comes from a downward revision for spontaneous growth. Suppose now that the final multiplier is worth 1.3 (the average across the range estimated by the IMF); the revision of the spontaneous growth in the euro zone then accounts for more than 50% of the revision in the forecast for the euro zone in 2012, which reflects the optimistic bias common to the Commission, the OECD and the IMF. In comparison, the revision of spontaneous growth accounts for less than 10% of the revision in the OFCE forecast for 2012.
On the other hand, the size of the multipliers inferred from the revisions of the forecasts for 2013 appears to accord with the range calculated by the IMF – on the order of 1.1 for the Commission, 1.3 for the OECD and 1.3 to 1.4 for the IMF. The revisions of the growth forecasts for 2013 can therefore be explained mainly by the revision of the fiscal impulses planned and the increase in the multipliers used. In this sense, the controversy over the size of the multipliers is indeed reflected in an increase in the size of the multipliers used in the forecasting of the major international institutions.
[1] See, for example, European Commission (2012): “Report on public finances in EMU”, European Economy no. 2012/4. More precisely, the multiplier from the QUEST model of the European Commission is equivalent to 1 the first year for a permanent shock to public investment or civil servant pay, 0.5 for other public expenditure, and less than 0.4 for taxes and transfers.
[i] See, for example, page 41 of the World Economic Outlook of the IMF from October 2012: “The main finding … is that the multipliers used in generating growth forecasts have been systematically too low since the start of the Great Recession, by 0.4 to 1.2, depending on the forecast source and the specifics of the estimation approach. Informal evidence suggests that the multipliers implicitly used to generate these forecasts are about 0.5. So actual multipliers may be higher, in the range of 0.9 to 1.7.”
[ii] See, for example, page 115 of the European Commission’s Report on Public finances in EMU: “In addition, there is a growing understanding that fiscal multipliers are non-linear and become larger in crisis periods because of the increase in aggregate uncertainty about aggregate demand and credit conditions, which therefore cannot be insured by any economic agent, of the presence of slack in the economy, of the larger share of consumers that are liquidity constrained, and of the more accommodative stance of monetary policy. Recent empirical works on US, Italy, Germany and France confirm this finding. It is thus reasonable to assume that in the present juncture, with most of the developed economies undergoing consolidations, and in the presence of tensions in the financial markets and high uncertainty, the multipliers for composition-balanced permanent consolidations are higher than normal.”
[iii] See, for example, page 20 of the OECD Economic Outlook from November 2012: “The size of the drag reflects the spillovers that arise from simultaneous consolidation in many countries, especially in the euro area, increasing standard fiscal multipliers by around a third according to model simulations, and the limited scope for monetary policy to react, possibly increasing the multipliers by an additional one-third.”

