Does Price Stability entail Financial Stability?

by Paul Hubert and Francesco Saraceno (@fsaraceno)

Paul Krugman raises the very important issue of the impact of monetary policy on financial stability. He starts with the well-known observation that, contrary to the predictions of some, expansionary monetary policy did not lead to inflation during the current crisis. He then continues arguing that tighter monetary policy would not necessarily guarantee financial stability either. If the Fed were to revert to a more standard Taylor rule, financial stability would not follow. As Krugman aptly argues, “That rule was devised to produce stable inflation; it would be a miracle, a benefaction from the gods, if that rule just happened to also be exactly what we need to avoid bubbles.

Krugman in fact takes position against the “conventional wisdom”, which has been widespread in academic and policy circles alike, that a link exists between financial and price stability; therefore the central bank can always keep in check financial instability by setting an appropriate inflation target.

The global financial crisis is a clear example of the fallacy of this conventional wisdom, as financial instability built up in a period of great moderation. A recent analysis by Christophe Blot, Jérôme Creel, Paul Hubert, Fabien Labondance and Francesco Saraceno shows that the crisis is no exception, as over the past few decades, in the US and the Eurozone, the link between price and financial stability has been unclear and moreover unstable over time, as shown on the following figure.

G1_Post2804ang_PH

We therefore subscribe to Krugman’s view that financial stability should be targeted by combining macro- and micro-prudential policies, and that inflation targeting is largely insufficient. In another work, Christophe Blot, Jérôme Creel, Paul Hubert and Fabien Labondance argue that the ECB should be endowed with a triple mandate for financial and macroeconomic stability, along with price stability. They further argue that the ECB should be given the instruments to effectively pursue these three, sometimes conflicting objectives.


The ECB’s quantitative easing exercise: you’re never too young to start

By Christophe BlotJérôme CreelPaul Hubert and  Fabien Labondance

The ECB decision to launch a quantitative easing (QE) programme was widely anticipated. Indeed, on several occasions in the second half of 2014 Mario Draghi had reiterated that the Governing Council was unanimous in its commitment to take the steps needed, in accordance with its mandate, to fight against the risk of a prolonged slowdown in inflation. Both the scale and the characteristics of the ECB plan announced on 22 January 2014 sent a strong, though perhaps belated signal of the Bank’s commitment to fight the risk of deflation, which has been spreading in the euro zone, as can be seen in particular in inflation expectations over a two-year horizon (Figure 1). In a special study entitled, “Que peut-on attendre du l’assouplissement quantitatif de la BCE?” [“What can we expect from the ECB’s quantitative easing?”], we clarify the implications of this new strategy by explaining the mechanisms for the transmission of quantitative easing, drawing on the numerous empirical studies on previous such programmes in the US, the UK and Japan.

Graphe_post24-04_Eng

The terms of the quantitative easing decided by the ECB are indeed similar to those adopted by other central banks, especially by the US Federal Reserve and the Bank of England, which make comparisons legitimate. It appears from the American, British and Japanese experience that the measures implemented have led to a decline in sovereign interest rates and more generally to an improvement in the financial conditions of the overall economy[1]. This has been the result of sending a signal about the present and future stance of monetary policy and a reallocation of investors’ portfolios. Some studies [2] also show that the US QE caused a depreciation of the dollar. The transmission of QE from the ECB to this variable could be critical in the case of the euro zone. An analysis using VAR models shows that the monetary policy measures taken by the ECB will have a significant impact on the euro but also on inflation and inflationary expectations. It is likely that the effects of the depreciation of the euro on European economic activity will be positive (cf.  Bruno Ducoudré and Eric Heyer), which would make it easier for Mario Draghi to bring inflation back on target. The measure would therefore have the positive effects expected; however, it might be regrettable that it was not implemented earlier, when the euro zone was mired in recession. Inflation in the euro zone has fallen constantly since late 2011, reflecting a gathering deflationary risk month after month. In fact, the implementation of QE from March 2015 will consolidate and strengthen a recovery that would undoubtedly have occurred anyway. Better late than never!


[1] The final impact on the real economy is, however, less certain, in particular because the demand for credit has remained stagnant.

[2] Gagnon, J., Raskin, M., Remache, J. and Sack, B. (2011). “The financial market effects of the Federal Reserve’s large-scale asset purchases,” International Journal of Central Banking, vol. 7(10), pp. 3-43.


Which companies are investing in France?

By Sarah Guillou

At a time when investment has become a priority for the European Union, the IMF and France, at a time when the French government is preparing legislation to boost business investment, it is urgent to look into who is actually investing in France’s physical capital[1].

Physical investment in France’s commercial sector is concentrated in certain sectors: manufacturing, trade, transport, real estate, information and communication, along with the generation of electricity and gas. These “big contributors” totalled 72% of all tangible investment in 1997, and 70% in 2011. This temporal stability obscures two major changes: the manufacturing and real estate sectors saw their contribution to investment change dramatically. The decline in manufacturing’s share of GDP has resulted in a decline in the share of investment in machinery and tools. However, this type of investment includes investments in automation and computerization, which are major vectors for boosting productivity. Nor was this decline offset by investment in the information and communication sector, which also invests heavily in machine tools.

The steep rise in real estate and construction prices inflated construction’s share of investment. It is particularly noteworthy that the increase in construction prices has captured a large share of business spending on capital investment, thereby diverting financial capital from productive destinations. While this dynamic growth in investment in construction has indeed positively influenced investment trends in physical assets, it mainly explains the dynamics of investment in the property sector. Construction prices have not fallen since the crisis, even though the volume of investment has fallen sharply.

The resilience of the investment rate France’s non-financial companies is due in part to investment in construction, but this holds true especially for the real estate sector and the transport sector.

The highest investment rates are on the part of the big corporations and firms with the highest profit rates. Furthermore, the rate of investment is positively correlated with the debt ratio, exporter status, export intensity and R&D intensity. In contrast, human capital indicators such as labour productivity or average hourly earnings tend to be negatively correlated with the investment rate.

The continuation of deindustrialization and the outsourcing of manufacturing could accelerate the decline in investment in machine tools and equipment. The development of information and communication technology and of this sector more generally could offset the decline in manufacturing. Given that investment in machine tools is a source of higher productivity, maintaining a solid level of activity in the manufacturing sector and the information and communications sector is imperative.


[1] Note de l’OFCE no. 50 of 22 April 2015 [in French] characterizes the sectors and companies that invest in France.


France: Recovery … at last!

By Mathieu PlaneBruno DucoudréPierre Madec, Hervé Péléraux and Raul Sampognaro

The OFCE’s forecast for the French economy in 2015-2016 is now available.

Not since the beginning of the subprime crisis has the French economy been in such a favourable situation for a recovery. The fall in oil prices, the ECB’s proactive and innovative policy, the easing of fiscal consolidation in France and the euro zone, the gathering impact of the CICE tax and the implementation of the Responsibility Pact (representing a tax transfer to business of 23 billion euros in 2015 and nearly 33 billion in 2016) all point in the same direction. The main obstacles that have held back French activity over the last four years (over-calibrated fiscal austerity, a strong euro, tight financial conditions, and high oil prices) should all be out of the way in 2015 and 2016, with pent-up growth finally released. The supply policy being pushed by the government, whose impact on business is still pending, will be all the more effective thanks to the positive demand shock from foreign trade, which will allow the economic rebalancing that was lacking up to now.

French GDP will grow by 1.4% in 2015, with the pace accelerating in the course of the year (to 2% yoy). The second half of 2015 will mark the turning point in the recovery, with the corporate investment rate picking up and the unemployment rate beginning to fall, ending the year at 9.8% (after 10% in late 2014). 2016 will then be the year of recovery, with GDP growth of 2.1%, a 4% increase in productive investment and the creation of nearly 200,000 private sector jobs, pushing the unemployment rate down to 9 5% by end 2016. In this positive context, the public deficit will fall significantly, and is expected to be 3.1% of GDP in 2016 (after 3.7% in 2015).

Obviously this virtuous cycle will only take effect if the macroeconomic environment remains favourable (low oil prices, a competitive euro, no new financial tensions in the euro zone, etc.) and if the government limits itself to the budget savings already announced.


On Thomas Piketty’s Capital in the Twenty-First Century

Presentation by Gérard Cornilleau

In 2014, the world of social science publications was marked by the appearance of Thomas Piketty’s book, Capital in the Twenty-First Century. The book’s global success, which is rare for a rather difficult work originally published in French, led to renewed debate on the distribution of wealth and income. Contrary to the widespread view that economic growth diminishes inequality and sooner or later leads to a balanced society with a large middle class (Kuznets’ hypothesis), Thomas Piketty uses long-term historical data, some of it new, to show that the norm is instead a widening gap between the rich and everyone else. Periods of falling inequality appear conversely to be related to accidents of political and social history (war, ideological upheaval, etc.). Therefore, and unless another countervailing accident were to occur, Western society seems doomed to suffer an increasingly severe imbalance in the distribution of wealth. Piketty believes that structural changes in taxation could contain this tendency, which is unsustainable in the long-term.

It is hardly surprising that this analysis has upset the applecart of the received wisdom and occasionally provoked strong reactions, and even denial that inequality is real – in other words, criticism that Piketty’s analysis is overly pessimistic. It was obvious that the OFCE needed to participate in this public debate. Several OFCE researchers have contributed by offering additional insights to Piketty’s arguments or critical analysis. These contributions can be found in a special dossier in issue 137 of the Revue de l’OFCE on Le capital au XXIe siècle [in French]. Jean-Luc Gaffard’s observations focus on issues related to the nature of capital and the relationship between its productive component, its remuneration and the regulation of the system as a whole, which could affect pessimistic conclusions about the long-term difference between the rate of profit and the rate of growth in output. Guillaume Allègre and Xavier Timbeau seek to deepen the analysis of the nature of capital, focussing on the rise in the compensation of property rights, which has led to the emergence of a new type of technological rentier. They also analyse the contribution of housing wealth before concluding, as does Piketty himself, that it is a key factor in inequality.

Thomas Piketty agreed to participate in this discussion by writing a response for the Revue de l’OFCE, in which he clarifies his thinking about a number of issues, such as the hybrid nature of capital, which mixes productive capital, housing wealth and intellectual property rights, whose yield has more to do with a process of social construction than with a simple technical relationship between capital and production.

This dossier also reflects the OFCE’s commitment to promote scientific debate around key issues in economics. Our thanks go to the authors who contributed to this discussion, and to Thomas Piketty who has engaged in this process of constructive criticism. Finally, we hope that this dossier will help give readers a better understanding of the importance of the issue of inequality and the role it plays in long-term social cohesion.


Shale gas: recovering a mirage?

By Aurélien Saussay

A report posted online on April 7 by Le Figaro assesses the gains that could be expected from the exploitation of shale gas in France: the report concludes that this is an opportunity to revive the French economy and cut France’s energy costs by substituting domestic production for our imports of gas. It estimates that the macroeconomic impact would be substantial: in the “likely” scenario, more than 200,000 jobs would be created, with an additional 1.7 points of GDP on average over a 30-year period.

The magnitude of these figures stems directly from the assumptions used in the report, especially in terms of geology. The production costs for a shale gas field and the volumes that could be extracted depend on the field’s physical characteristics (depth, permeability, ductility of the rock, etc.). However, without carrying out any experimental fracking, it is very difficult to make a future estimate of all of these parameters, and hence of the final production cost.

It is nevertheless possible to see how these parameters are distributed in the only territory that has extensively exploited shale gas up to now: the United States. By reviewing the production data for the US deposits accumulated over more than ten years, a realistic distribution of production costs can be modelled. This is the approach adopted to develop the SHERPA model, which is described in an OFCE working paper published today, Can the U.S. shale revolution be duplicated in Europe?

More than 60 shale gas deposits have been explored in the United States since it first began to be exploited in the early 2000s. But only 30 have been put into commercial production, and six of these account for over 90% of the total US output of shale gas. Based on the geological assumptions corresponding to the median of the six best deposits, the Net Present Value (NPV) of France’s gas resources comes to 15 billion euros – 15 times less than the 224 billion estimated in the aforementioned report. To reach this latter figure, it must be assumed both that the cost of drilling and well completion will be similar in France and the United States, and that the French deposits are comparable to the best American field, around Haynesville, Louisiana … but the characteristics of that field are exceptional: the average output of its gas wells is nearly four times the average of the five other main deposits. While it is of course impossible a priori to exclude that this latter assumption would hold, it is very unlikely.

This uncertainty emphasizes the need to carry out experimental drilling to guard against overly optimistic scenarios. The case of Poland is instructive: the projections of the US Energy Information Agency (EIA) pointed to very large shale gas reserves in a country that is heavily dependent on imports of Russian gas. The Polish government, keen to strengthen its energy independence, decided to try to speed up domestic production, offering up to a third of its territory for operating concessions. The first wells were disappointing: it turned out that the rocks in the Polish deposit contained too much clay, making them too ductile and impeding good fracturing of the rock – an essential step for exploiting shale gas, regardless of which technology is used. After the trials, Poland’s substantial reserves, touted as the largest in Europe, proved to be unworkable.

This kind of evaluation should be made in a way that is public and transparent. Professional prospectors, whose main activity is to assess the geological reality of a hydrocarbon deposit previously estimated on paper, in fact have an interest in overestimating the pre-drilling assessments in order to sell their services. An example from abroad once again shows the extent of the problem: in May 2014, the US EIA reported that the estimate of the exploitable volume of shale oil in the US Monterey deposit, hitherto regarded as one of the most promising, was being slashed by 96%. After a review, it was clear that the first estimate, made two years earlier, had been based entirely on the calculations of private independent prospectors, without the intervention of the governmental services of the US Geological Survey.

To ensure a realistic assessment of France’s resources of shale gas, experimental drilling needs to be entrusted to a public body, with fully transparent results and methodology. Only an approach like this can ensure that future scenarios are objective and not unduly optimistic.


The erosion of France’s productive base: causes and remedies

Xavier Ragot, President of the OFCE and the CNRS

The deindustrialization of France, and more generally the difficulties facing sectors exposed to international competition, reflects trends that have been at work in France and in Europe for more than a decade. Indeed, while the strictly financial moment when the crisis struck in 2007 was the result of the bursting of the American real estate bubble, the scale of its impact on Europe’s economy cannot be understood without looking at vulnerabilities that have previously been neglected.

In “Érosion du tissu productif en France: Causes et remèdes”, OFCE working document no. 2015-04, Michel Aglietta and I offer a summary of both the microeconomic and macroeconomic factors behind this productive drift. Such a synthesis is essential. Before proposing any policy changes for France, it is necessary to make a coherent diagnosis of major trends in international trade as well as of the real situation of France’s productive fabric.

European divergences

The starting point is the surprising divergence seen in Europe. The euro zone’s two largest countries, Germany and France, have diverged in an unprecedented way since the mid-1990s. While property prices remained stable in Germany, in France they increased by a factor of 2.5, hitting the country with two negative consequences: a high cost of living for its employees, and a collapse in property investment by its businesses. Wages in Germany are now 20% lower than in France due to the wage moderation implemented to manage the former’s reunification process. Furthermore, until the crisis, real short-term interest rates (which take into account inflation differentials) were about 1 percentage point lower in France and Spain than in Germany. This change in the price of the production factors (higher real interest rates and lower wages in Germany than in France) did not give rise to a greater substitution of capital for labour in France. There was little difference between the two countries in the investment rate, which was relatively stable in both. Other indicators, such as the number of robots, indicate on the contrary that there was less modernization of France’s productive fabric. These changes in factor prices have not therefore translated into an adjustment in the productive fabric, but have instead led to an unsustainable divergence in the current accounts.

Current account balances are crucial concepts for measuring disequilibria within Europe. A positive current account means that a country is lending to the rest of the world, while a negative current account means that it is borrowing from the rest of the world. While European rules have focused attention on the public deficit alone, the proper measure of a country’s indebtedness is the current account, the sum of public and private debt. On this measure, Germany’s current account is one of the most positive in the world, meaning that it is lending heavily to other countries. While over the last three years the differences between European current accounts have been narrowing, this is the result more of a contraction in activity due to austerity measures than of a modernization of the productive base in countries with negative current accounts. The European framework for analysing macroeconomic imbalances does of course have numerous indicators, including the current account. However, in practice the multiplicity of indicators gives a crucial role to the numerical public deficit targets. So while the framework for European surveillance seems very general in its assessment of economic imbalances, it is the short-term budgetary aspect alone that dominates analysis. Don’t forget that Spain’s public debt was less than 40% of GDP in 2007, but over 90% of GDP in 2013. Low public debts are not therefore a sufficient condition for macroeconomic stability, just as public debts that are temporarily high are not necessarily a sign of structural problems.

The fragility of France’s productive base

In this sense, corporate data can be used to gain insight into trends in the French economy. French companies did of course experience a fall in margins, but this has mainly affected sectors exposed to international competition. Corporate profitability (which finances the payment of dividends and interest and contributes to investment) fell from 6.2% in 2000 to less than 5% in 2012. Despite this decline, the investment rate held steady in all business categories during the period, in part funded by corporate savings, which declined from a rate of 16% in 2000 to 13% in 2012. The result has been a substantial rise in corporate debt, although up to now this has not led by higher debt costs due to the fall in interest rates. All these factors are inevitably fuelling concern about the health of our productive fabric: France’s businesses have responded to economic difficulties, not by innovation, but by financializing their balance sheets and taking on debt.

Towards partnership in governance

To innovate, invest and upscale, France’s companies must make efforts over the long term – this is the only way there will be a process of reconvergence in Europe. The point is not to maximize short-term financial returns, through for example excessive dividend payments, but rather to invest over horizons that are typically considered (too) long by companies. As a result, making improvements to France’s productive fabric will require shifting corporate governance towards a model based on stronger partnerships and a more long-term vision in order to invest in employees’ skills and qualifications, in intangible assets, and in new technologies. Social dialogue is not just about income distribution and tax reform but is also essential within companies in order to ensure the mobilization of our only productive wealth, men and women who are putting their all into their work.


Concerning the Macron law “to promote growth, activity and equal economic opportunity”

By Henri Sterdyniak

The Macron Law is certainly not the “law of the century”. It is a patchwork of about 240 provisions of varying importance. It is not some “great turn to the free market” nor does it represent a uniquely French strategy. It does nevertheless raise interesting questions about France’s economic strategy and the way the legislature works.

The latest issue of the Note de l’OFCE (no. 43 of 13 March 2015)  examines the law’s major provisions, which oscillate between free market liberalization (let competition and the market do their work), social liberalism (certain categories of the population must be protected), economic interventionism (the state must regulate the functioning of the markets), and social democracy (the social partners must play an important role), without a clear victory for any of these. It is a compromise text that by definition cannot really satisfy anyone.

In our view, despite its title, there are few provisions in the law that will promote activity or that are beneficial to industry, to “Made in France”, to urban renewal, to the habitat, to the production of sustainable recyclable goods, or to greater employee participation in the decision-making process in their business. The law is instead in line with the myth of an economy driven by innovative start-ups, and ignores the need for industrial restructuring and an ecological transition.


Women’s employment and unemployment: decreasing inequality?

By Françoise Milewski

The deterioration of the labour market since the start of the crisis has hit men and women differently. Recent trends show that adjustments are being made in different ways. Gender inequalities are producing differentiated trends in employment and unemployment, which is leading in turn to specific forms of inequality.

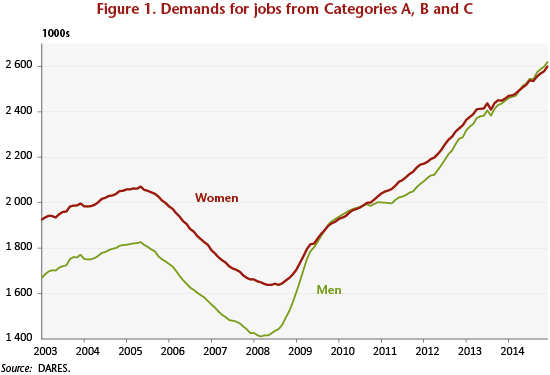
Since spring 2008, category A job searches [1] have increased for both men and women, but much more for the former (93% against 60%). The trend was more uneven for men under the influence of the business and public policy cycles, especially partial unemployment measures.

Men jobseekers have outnumbered women jobseekers since November 2008. In December 2014, men represented 52.9% of jobseekers. But this breakdown is close to their respective shares in the labour force and in employment. It is the previously existing situation that was abnormal: women, a minority on the labour market, had been a majority in category A unemployment.

Despite this, job searches by those on low hours [2], that is to say, people who have a part-time job but are registered at the job centre because they want to work more, are mostly by women (55.4%); this proportion has not changed much from before the crisis. Women are also over-represented in category B, short-term low-hours jobs. The increase in job applications from those on low hours was slower and less uneven than those in category A. It was also less differentiated by gender.

Overall, if we take into account demands for jobs from categories A, B and C, there have  been slightly more men jobseekers than women since summer 2014 (50.2% in December 2014). This is a new feature of the labour market (Figure 1).

This characteristic holds true for those who are under age 25 and age 25 to 49. In contrast, more women over the age of 50 are unemployed than men, due to the high level of job applications from those working low hours.

G1_Post0203ang

The impact of the lack of gender diversity of professions and employment sectors

These trends are due to changes in employment. Women are concentrated in the service sector, and men more in industry and construction. But the greatest job losses have occurred in industry and construction. The services, which are traditionally less cyclical, have seen fewer job losses, and even some job creation in a few years (from 2010 to 2012 and then in 2014) if interim work is reassigned to the user sectors. This job creation has been on a small scale, but women’s employment has suffered less from the crisis, or at least in a different way. It fell in 2009, then increased slightly, and then stabilized.  This is of course a break in the trends for growth rates in the 1980s, 1990s and 2000s, but there is a clear difference with men’s employment, which fell significantly in 2009 and again in 2012 and 2013. The 1980s and 1990s were already not favourable years for men’s employment.

Single-sex trades result from the gender-biased school experience and job training, and reinforce this in return. This explains why there are such great differences in job opportunities between sectors. Service jobs, particularly personal services, are the preserve of women: their supposedly “innate” skills lead them to do in the commercial sphere what they are already doing in the family sphere: upbringing, educating, caring for others, cleaning, etc.

Inequalities in career guidance thus have a “positive” counterpart in employment, at least if we confine ourselves to the volume of jobs. But the poor quality of certain jobs and their under-valuation also stems from this.

A trend in employment rates favouring women

The participation and employment rates can be linked with the unemployment rate (according to the ILO [3]) in order to clarify both the differences between women and men and the profound differences by age group.

Taking all ages combined, women have increased their labour force participation rates over the period 2008-2014 (2.3 points). Their employment rate fell between 2008 and 2010 and then recovered to exceed its pre-crisis level. The unemployment rate thus rose sharply in the initial period of the crisis, then stabilized before rising again since early 2012, with the increase in the employment rate remaining lower than in the participation rate. The full-time employment rate at first declined and then stabilized, while the rate of part-time employment rose slightly. The share of part-time employment is up from early 2008, but only by 1 point.

With respect to men, the participation rate increased very slightly (+0.6 point) while the employment rate decreased significantly (-2.1 points), resulting in the greater increase in unemployment. The decline in men’s employment rate is associated essentially with full-time employment. As the level of part-time employment is still very low, its increase has had little impact on the overall picture. The share of part-time employment for men did, however, rise from 5.5% in spring 2008 to 8% in the third quarter of 2014.

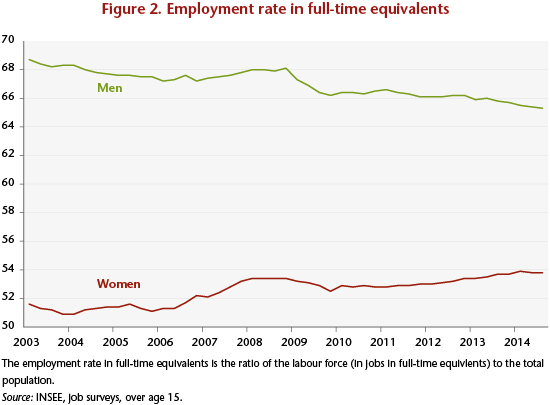
The employment rate in full-time equivalents is therefore diverging: the rate for men fell over the period, while women’s rate, following a decline at the start of the crisis, has been picking up at a moderate but steady pace since 2011 (Figure 2).

G2_Post0203ang

The “halo” around unemployment[4] has grown, particularly among men (+37.4% compared with +8.8%), but women are still over-represented in it (56.9% of the total at end 2014).

However, these averages reflect trends that differ greatly by age group. The stabilization of the male participation rate is the result of a decline for both young people and those aged 25-49 together with a rise for those over age 50. But the rise in the employment rate of older workers has not been sufficient to offset the decline in other categories. For women, only the participation rate for those aged 15-24 has been declining, and the higher employment rates of those over 50 has offset the decline in the rates for both young people and, more moderately, for those age 25-49.

Older employees have been especially affected

The labour force participation, employment and unemployment of older workers are atypical because this age group’s position has been weakened by the impact of the later retirement age. The trends in unemployment rates have been similar for both genders, including in terms of volume. The participation rate has risen steeply since 2009: for men, this follows a long period of decline until 1995, then a rise due to the 1993 pension reform, followed by a renewed decline (moderate) between 2003 and 2008. The rise since 2009 petered out in 2013 and 2014 (due to the end-of-work measures affecting workers age 60 with lengthy careers, which in practice mainly affected men). For women, the increase has been continuous since 1990: after plateauing between 2005 and 2008, the rise picked up pace, without the tapering-off seen at the end of this period for men. The steadier increase for women reflected the rise of the participation rates of the younger generation in previous decades. The employment rates have not risen as steeply as the participation rates, as unemployment has increased for both sexes. The difficulty of finding a job has also pushed up part-time employment rates, especially for women. The share of part-time employment reached 10.2% for men at the end of the period (still significantly below women’s rate: 33.4%).

The unemployment rate of 25-49 year-olds increased for both sexes, especially for men, leading to a convergence in rates since end 2012. However, men’s activity rate declined slightly since the beginning of the crisis, in contrast to women’s rate, which on average stabilized over the period. The fall in employment rates was very marked for men (-5.2 points), and less so for women (-1.7). This was also the case for full-time employment rates. The share of part-time employment has been increasing a little for men, but is still very low (just over 5%), while it has stabilized for women. The employment rates in full-time equivalents have changed very differently: the rate has fallen steeply for men, but only a little for women. The deterioration in the volume of employment is thus hitting men in particular. But the levels are still very different.

Young women do not benefit as much from their education

The unemployment rates for men and women under age 25 converged in the early 2000s, in contrast to other age groups. Since then, they have tended to evolve similarly. The level of the labour force participation rates differs significantly, with women’s rate still about 7 percentage points below that of men. The participation rates have declined in tandem since the crisis began, as have employment rates. Young people who are unable to find jobs are prolonging their education.

It is the rate of full-time employment that has declined the most, especially for young men. The part-time employment rate failed to offset this decline: it remained stable for men, except since the end of 2012, when it rose slightly, while it decreased for women (but only moderately).

It is striking to see the large difference in the respective levels of part-time employment even at this age (about 4 points). But the cause is not parental duties! The reason needs to be sought instead in the nature of the jobs associated with different professions and industrial sectors. Part-time work as a share of all employment came to nearly 35% for women at year-end, against 17% for men. This, however, is up sharply over the last six quarters. It is too early to say that this represents a rupture with previous trends, with the crisis leading young men to take jobs that they previously refused, or that they are shifting more towards service sector work that hasn’t been hit as hard.

The level of training is to the advantage of women. Yet it is clear, first, that a diploma offers protection against unemployment and the crisis (the highest unemployment rates are among those with few or no qualifications), and second, that girls do better in school and on average graduate more frequently. How then is it possible to explain that the unemployment rate is equivalent for men and women? An INSEE study on career starts was conducted in 2010 over the period 1984 to 2008[5]. It showed that in the early 1980s significantly more women were unemployed relative to men during the initial five years of working life, but that the gap has narrowed, with the unemployment rates converging in 2002. In 2007 and 2008, the female unemployment rate had fallen even lower than that of men at career start, thanks to the rise in their educational level. For the same level of training, young men usually fare better on the labour market: young women still tend to have higher unemployment rates and lower salaries because of the educational specialties they have chosen. The INSEE estimated that for identical degrees, specialties and job lengths, women’s risk of unemployment was 7% higher than for men during their initial years of work.

What about since the crisis? The CEREQ conducts work surveys on the future of young people leaving the education system. The last of these “Generation surveys” was conducted in 2013 on the 2010 generation[6]. It shows a worsening situation due to the crisis and very sharp differences by degree level. In 2013, three years after leaving school, 22% of young people were still hunting for work. This is the highest level ever seen in the CEREQ surveys. The increase over the 2004 generation was 16 points for young people without degrees and 3 points for long-term higher education graduates.

Better-educated women are standing up to the crisis better. For the 2010 generation (contrary to the 2004 generation), the employment rate for men decreased so as to match women’s rate, and the unemployment rate for women is lower than that for men. Young men are more exposed to long-term unemployment. Women’s relative advantage is due to their higher level of schooling, which has risen more than that for men.

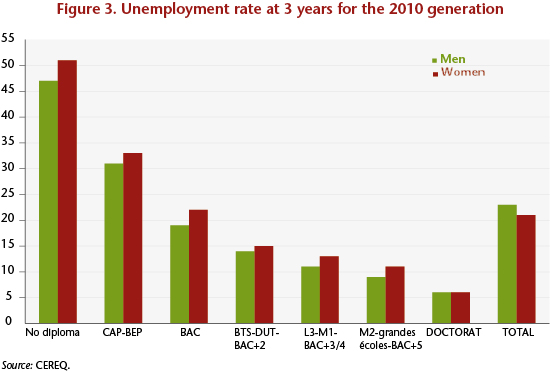
But there are persistent inequalities in the labour market, to the disadvantage of women: for comparable schooling at any level (from non-graduates to high school diploma +5 years, except the PhD level), the unemployment rate for women is higher than for men (Figure 3). Thus, women’s lower level of unemployment is due only to their higher level of education, which does not have a full impact.

G3_Post0203ang

A reconfiguration of inequality

The inequalities between women and men are shifting, but persistent. Unemployment has increased less among women during the crisis than among men. This is due, first, to the sectoral distribution of their jobs (especially in the service sector) and to single-sex trades. Second, raising the average level of education has enabled women to withstand the crisis better, but the magnitude of this effect is lower than it should be. It is therefore not enough to wait for time to do its work: even among the young generations, there is still discrimination in hiring and in the initial years of working life. Unless, of course, we await a time (hypothetical and hardly desirable) when generations of highly skilled women will exist side by side with generations of unskilled men, and labour market inequalities finally diminish…

Job quality is also a real challenge: part-time work is spreading among men, especially the older and younger age groups, but it is still particularly widespread among women, who continue to assume most parental duties. But part-time work is also more common among women under age 25 who are not yet in this situation.

Service jobs, particularly personal services, offer opportunities for the less skilled, but often part-time. Do we really want women to more readily accept “poor” jobs?

What is taking place is, therefore, a reconfiguration: women are improving their educational level, and the increasing numbers of them with higher qualifications are becoming a stable part of the workforce. However, they benefit less from their training, not only in terms of their salary and career progression, but even when they first begin their working lives, including in terms of employment and unemployment. Less-qualified women are at a particular disadvantage and form the core of the “precariat”, which is growing. Deregulating the labour market tends to amplify inequalities by forcing those in a weaker position on the labour market to accept part-time work with reduced hours on a large scale. So it is not enough to wait for inequalities to disappear or even diminish.


[1] Category A: Job seekers registered at the French Pôle emploi job centre who are unemployed and required to conduct a positive job search.

[2] Job seekers registered at the French Pôle emploi job centre who are required to conduct a positive job search and have worked fewer hours (78 hours or less during the month) for category B, or more hours but less than full time (more than 78 hours in the month) for category C.

[3] An unemployed person within the meaning of the International Labour Office (ILO) is a person of working age (15 or older) who has not worked, even for one hour, during the given week, is available for work within two weeks, and has begun an active job search in the previous month (or found a job that starts within three months). The unemployment rate is the ratio between the number of unemployed and the number of people in employment (employed or unemployed).

[4] The halo around unemployment includes people who do not have jobs and want to work but who are not considered unemployed by ILO standards as they are not available to work within two weeks and / or are not seeking work.

[5] “Femmes et hommes en début de carrière. Les femmes commencent à tirer profit de leur réussite scolaire” [Women and men at the start of the career. Women are beginning to benefit from their success at school], Alice Mainguené and Daniel Martinelli, Insee Première, no. 1284, February 2010, http://www.insee.fr/fr/themes/document.asp?ref_id=ip1284.

[6] “Face à la crise, le fossé se creuse entre niveaux de diplôme” [In the face of the crisis, the gap is increasing between diploma levels], Christophe Barret, Florence Ryk, Noémie Volle, Bref CEREQ no. 319, March 2014, http://www.cereq.fr/index.php/publications/Bref/Enquete-2013-aupres-de-la-Generation-2010-Face-a-la-crise-le-fosse-se-creuse-entre-niveaux-de-diplome.


Should Germany’s surpluses be punished?

By Henri Sterdyniak

On the procedure for macroeconomic imbalances

Since 2012, every year the European Commission analyses the macroeconomic imbalances in Europe: in November, an alert mechanism sets out any imbalances, country by country. Countries with imbalances are then subjected to an in-depth review, leading to recommendations by the European Council based on Commission proposals. With respect to the euro zone countries, if the imbalances are considered excessive, the Member state is subject to a macroeconomic imbalance procedure (MIP) and must submit a plan for corrective action, which must be approved by the Council.

The alert mechanism is based on a scoreboard with five indicators of external imbalances [1] (current account balance, net international investment position, change in the real effective exchange rate, change in export market shares, change in nominal unit labour costs) and six indicators of internal imbalances (unemployment rate, change in housing prices, public debt, private debt, change in financial sector liabilities, credit flows to the private sector). An alert is issued when an indicator exceeds a certain threshold, e.g. 60% of GDP for public debt, 10% for the unemployment rate, -4% (+6% respectively) for a current account deficit (respectively surplus).

On the one hand, this process draws lessons from the rise in imbalances recorded before the crisis. At the time of the Maastricht Treaty, the negotiators were convinced that economic imbalances could only come from the way the State behaved; it therefore sufficed to set limits on government deficits and debt. However, between 1999 and 2007, the euro zone saw a steep rise in imbalances due mainly to private behaviour: financial exuberance, securities and property bubbles, swollen foreign deficits in southern Europe, and a frantic search for competitiveness in Germany. These imbalances became intolerable after the financial crisis, requiring painful adjustments. The MIP is thus designed to prevent such mistakes from happening again.

On the other hand, the analysis and the recommendations are made on a purely national basis. The Commission does not propose a European strategy that would enable the countries to move towards full employment while reabsorbing intra-zone imbalances. It does not take into account inter-country interactions when it demands that each country improve its competitiveness while cutting its deficit. The Commission’s recommendations are a bit like the buzzing of a gadfly when it proclaims that Spain should reduce its unemployment, France should improve its competitiveness, etc. Its proposals are based on a myth: it is possible to implement policies on public deficit and debt reduction, on wage austerity and on private debt reduction, while offsetting their depressive impact on growth and employment through structural reforms, which are the deus ex machina of the fable. This year there is also, fortunately, the European Fund for strategic investments (the 315 billion euros of the Juncker plan), meaning that the Commission can claim to be giving “a coordinated boost to investment”, but this plan represents at most only 0.6% of GDP over 3 years; its actual magnitude is thus problematic.

For 2015, all the countries in the European Union have at least one imbalance according to the scoreboard [2] (see here). France has lost too much of its export market share and has an excessive public debt and private debt. Germany, too, has lost too much of its export market share, its public debt is excessive and above all its current account surplus is too high. Of the 19 countries in the euro zone, seven, however, have been absolved by the Commission and 12 are subject to an in-depth review, to be published in late February. Let’s take a closer look at the German case.

On Germany’s surplus

A single currency means that the economic situation and policies of each country can have consequences for its partners. A country that has excessive demand (due to its fiscal policy or to financial exuberance that leads to an excess of private credit) and is experiencing inflation (which can lead to a rise in the ECB’s interest rate), thereby widening the euro zone’s deficit (which may contribute to a fall in the euro), requires its partners to refinance it more or less automatically (in particular via TARGET2, the system of automatic transfers between the central banks of the euro zone); its debt can thus become a problem.

This leads to two observations:

1. Larger countries can have a more harmful impact on the zone as a whole, but they are also better able to withstand the pressures of the Commission and its partners.

2. The harm has to be real. Thus, a country that has a large public deficit will not harm its partners, on the contrary, if the deficit makes up for a shortfall in its private demand.

Imagine that a euro zone country (say, Germany) set out to boost its competitiveness by freezing its wages or ensuring that they rise much more slowly than labour productivity; it would gain market share, enabling it to boost its growth through its trade balance while reining in domestic demand, to the detriment of its euro zone partners. The partners would see their competitiveness deteriorate, their external deficits widen, and their GDP shrink. They would then have to choose between two strategies: either to imitate Germany, which would plunge Europe into a depression through a lack of demand; or to prop up demand, which would lead to a large external deficit. The more a country manages to hold down its wages, the more it would seem to be a winner. Thus, a country running a surplus could brag about its good economic performance in terms of employment and its public account and trade balances. As it is lending to other member countries, it is in a strong position to impose its choices on Europe. A country that is building up deficits would sooner or later come up against the mistrust of the financial markets, which would impose high interest rates on it; its partners may refuse to lend to it. But there is nothing stopping a country that is accumulating surpluses. With a single currency, it doesn’t have to worry about its currency appreciating; this corrective mechanism is blocked.

Germany can therefore play a dominant role in Europe without having an economic policy that befits this role. The United States played a hegemonic role at the global level while running a large current account deficit that made up for the deficits of the oil-exporting countries and the fast-growing Asian countries, in particular China; it balanced global growth by acting as a “consumer of last resort”. Germany is doing the opposite, which is destabilizing the euro zone. It has automatically become the “lender of last resort”. The fact is that Germany’s build-up of a surplus must also be translated into the build-up of debt; it is therefore unsustainable.

Worse, Germany wants to continue to run a surplus while demanding that the Southern European countries repay their debts. This is a logical impossibility. The countries of Southern Europe cannot repay their debts unless they run a surplus, unless Germany agrees to be repaid by running a deficit, which it is currently refusing to do. This is why it is legitimate for Germany to be subject to an MIP – an MIP that must be binding.

The current situation

In 2014, Germany’s current account surplus represented 7.7% of GDP (or 295 billion euros, Table 1); for the Netherlands the figure was 8.5% of GDP. These countries represent an exception by continuing to run a strong external surplus, while most countries have come much closer to equilibrium compared with the situation in 2007. This is in particular the case of China and Japan. Germany now has the highest current account surplus of any country in the world. Its surplus would be even 1.5 GDP points higher if the euro zone countries (particularly those in Southern Europe) were closer to their potential output. Thanks to Germany and the Netherlands, the euro zone, though facing depression and high unemployment, has run a surplus of 373 billion dollars compared with a deficit of 438 billion for the United States: logically, Europe should be seeking to boost growth not by a depreciation of the euro against the dollar, which would further widen the disparity in trade balances between the euro zone and the United States, but by a strong recovery in domestic demand. If Germany owes its surplus to its competitiveness policy, it is also benefitting from the existence of the single currency, which is allowing it to avoid a surge in its currency or a depreciation in the currency of its European partners. The counterpart of this situation is that Germany has to pay its European partners so that they remain in the euro.

TAB1_post0303HSang

There are three possible viewpoints. For optimists, Germany’s surplus is not a problem; as the country’s population ages, Germans are planning for retirement by accumulating foreign assets, which will be used to fund their retirements. The Germans prefer investing abroad rather than in Germany, which they feel is less profitable. These investments have fuelled international financial speculation (many German financial institutions suffered significant losses during the financial crisis due to adventurous investments on the US markets or the Spanish property market); now they are fuelling European debt. Thus, through the TARGET2 system, Germany’s banks have indirectly lent 515 billion euros to other European banks at a virtually zero interest rate. Out of its 300 billion surplus, Germany spends a net balance of only 30 billion on direct investment. Germany needs a more coherent policy, using its current account surpluses to make productive investments in Germany, Europe and worldwide.

Another optimistic view is that the German surplus will decline automatically. The ensuing fall in unemployment would create tensions on the labour market, leading to wage increases that would also be encouraged by the establishment of the minimum wage in January 2015. It is true that in recent years, German growth has been driven more by domestic demand and less by the external balance than prior to the crisis (Table 2): in 2014, GDP grew by 1.2% in Germany (against 0.7% in France and 0.8% for the euro zone), but this pace is insufficient for a solid recovery. The introduction of the minimum wage, despite its limitations (see A minimum wage in Germany: a small step for Europe, a big one for Germany), will lead to a 3% increase in payroll in Germany and for some sectors will reduce the competitiveness gains associated with the use of workers from Eastern Europe. Even so, by 2007 (relative to 1997), Germany had gained 16.3% in competitiveness compared to France (26.1% compared to Spain, Table 3); in 2014, the gain was still 13.5% relative to France (14.7% relative to Spain). A rebalancing is taking place very slowly. And in the medium term, for demographic reasons, the need for growth in Germany is about 0.9 points lower than the need in France.

TAB2_post0303HSang

TAB3_post0303HSang

Furthermore, a more pessimistic view argues that Germany should be subject to a macroeconomic imbalance procedure to get it to carry out a macroeconomic policy that is more favourable to its partners. The German people should benefit more from its excellent productivity. Four points need to be emphasised:

1.  In 2014, Germany recorded a public surplus of 0.6 percent of GDP, which corresponds, according to the Commission’s estimates, to a structural surplus of about 1 GDP point, i.e. 1.5 points more than the target set by the Fiscal Compact. At the same time, spending on public investment was only 2.2 GDP points (against 2.8 points in the euro zone and 3.9 points in France). The country’s public infrastructure is in poor condition. Germany should increase its investment by 1.5 to 2 additional GDP points.

2.  Germany has undertaken a programme to reduce public pensions, which has encouraged households to increase their retirement savings. The poverty rate has increased significantly in recent years, reaching 16.1% in 2014 (against 13.7% in France). A programme to revive social protection and improve the prospects for retirement[3] would boost consumption and reduce the savings rate.

3.  Germany should restore a growth rate for wages that is in line with growth in labour productivity, and even consider some catch-up. This is not easy to implement in a country where wage developments depend mainly on decentralized collective bargaining. This cannot be based solely on raising the minimum wage, which would distort the wage structure too much.

4.  Finally, Germany needs to review its investment policy[4]: Germany should invest in Germany (public and private investment); it should invest in direct productive investment in Europe and significantly reduce its financial investments. This will automatically reduce its unproductive investments that go through TARGET2.

Germany currently has a relatively low rate of investment (19.7% of GDP against 22.1% for France) and a high private sector savings rate (23.4% against 19.5% for France). This should be corrected by raising wages and lowering the savings rate.

As Germany is relatively close to full employment, a significant part of its recovery will benefit its European partners, but this is necessary to rebalance Europe. Any policy suggested by the MIP should require a change in Germany’s economic strategy, which it considers to be a success. But European integration requires that each country considers its choice of economic policy and the direction of its growth model while taking into account European interdependencies, with the aim of contributing to balanced growth for the euro zone as a whole. An approach like this would not only benefit the rest of Europe, it would also be beneficial to Germany, which could then choose to reduce inequality and promote consumption and future growth through a programme of investment.


[1] For more detail, see European Commission (2012) : “Scoreboard for the surveillance of macroeconomic imbalances”, European Economy Occasional Papers 92.

[2] This partly reflects the fact that some of these indicators are not relevant: almost all European countries are losing market share at the global level; changes in the real effective exchange rate depend on trends in the euro, which the countries do not control; the public and private debt thresholds were set at very low levels; etc.

[3] The ruling coalition has already raised the pensions of mothers and allowed retirement at age 63 for people with lengthy careers, but this is timid compared with previous reforms.

[4] The lack of public and private investment in Germany has been denounced in particular by the economists of the DIW, see for example: “Germany must invest more for future”, DIW Economic Bulletin 8.2013 and Die Deutschland Illusion, Marcel Fratzscher, October 2014.