Do separated fathers bear a greater sacrifice in their standard of living than their ex-partners?

by Hélène Périvier OFCE-PRESAGE

The recent study published by France Strategy on the sharing of the costs of children after a separation has caused a stir (see in particular Dare feminism, Abandoning the family, as well as SOS Papa [all in French]). The study analyses the changes in the standard of living of both the former spouses, taking into account the interaction between the indicative scale for child support and the tax-benefit system. This approach is stimulating, as it endeavours to see whether the redistribution effected through the welfare state fairly and equitably deals with the costs of the child borne by each former spouse.

It is reported that after separating, the living standards of the two former partners fell sharply. In addition, simulations of typical cases “indicate that as a result of applying the scale [the indicative reference scale provided to judges] under existing social and tax legislation, the care of children causes a significantly greater sacrifice in the standard of living of the non-custodial parent than of the custodial parent”. In other words, separated fathers are making a greater sacrifice in their standard of living than are the mothers, if the judge were to apply the indicative scale to the letter. But according to the Ministry of Justice the scale is not applied by judges, as both situations are always very specific. So the study looks at what the standard of living of the separated parents would be if the scale were applied, and not at their actual standard of living. However the table of results presented in the note on the front page is titled, “Estimating the loss of living standards incurred by the parents of two children (as a percentage compared to the situation with no child, calculation net of state aid)”. Someone reading this quickly could easily think this was the real situation of separated parents.

Even though the study is based on the scale for support payments and not on the decisions of the judges themselves, it raises a relevant question. But the results are weakened by significant methodological problems: the concept of the sacrifice in the standard of living does not take into account the gender division of labour and its impact on mothers’ careers; the typical cases highlighted are not necessarily representative (in particular concerning marital status prior to separation); using the equivalence scales [1] leads to conflating the “household standard of living” and “the individual standard of living”; and finally, an approach based on maintaining the child’s standard of living would have led to a completely different result. Ultimately, proposing the micro-simulation model as an aid to the judges’ decision-making seems somewhat premature in light of these criticisms.

On the concept of “a sacrifice in the standard of living” 

In all the cases simulated, the separated parents’ living standards go down relative to their situation as a couple (assuming unchanged income). This result is consistent with other recent work, such as Martin and Périvier, 2015; Bonnet, Garbinti, Solaz, 2015; and the report of France’s Family Council (the HCF). A separation is costly for both parents due to the loss of economies of scale (e.g. two homes are needed instead of one, etc.). In addition to the decline in living standards for each parent, the authors calculate the “sacrifice in living standards” experienced by the parents after the separation.

The “living standard sacrifice” is supposed to be calculated by comparing the cost of the child to the disposable income that the parent would have had if there were no child. However, the living standard sacrifice made by the mother with custody of the child (or the father, respectively) is actually calculated by comparing the child’s cost with the standard of living of a single woman without children with the same salary level as the separated mother (and the same for the father).

This method cannot be used to estimate the “living standard sacrifice”, since forming a couple and a family are accompanied by a gender division of labour, which has been widely documented in the literature and which implies that the separated wife has a salary level, and more generally a career, that is different from what she would have had if she had remained single with no children. If a woman senior executive living in a couple stops working in order to look after the children and then the couple separates, the concept of the “living standard sacrifice” would imply a significant gain in the quality of life for this woman, since the cost of the children would be relative to the RSA minimum income, whereas she would have received a higher salary if she had not had children because she would have continued to work.

In other words, the proper counterfactual, that is to say the situation with which we must compare the level of the separated parent so as to assess the living standard sacrifice that she (or he) suffers, should be the income that the woman (or man) would have had when separated (taking into account their individual characteristics) if she (or he) had not entered a couple and if she (or he) had not had children. By doing this, the calculations would have led to a significantly greater sacrifice by the woman than that calculated in the study. Here we see the need for an economic approach that integrates the behaviour of agents, compared with an accounting approach.

Atypical typical cases?

The authors used the micro-simulation model Openfisca to simulate different situations and assess the loss in living standard by each former spouse after the separation.

The typical cases are used to understand the complex interactions between the tax-benefit system and, for the subject matter here, the indicative scale of child support payments. The criticism usually made of typical case studies is that they do not reflect the representativeness of the situations simulated: so to avoid focusing on marginal cases, data is added about the frequency of the situations selected as “typical”. With respect to the distribution of income, in three-quarters of the cases the women earn less than their male partners (Insee). What would be needed is to look at the distribution of income between spouses before the break and see what are the most common cases and then to refine the operation by retaining only those cases where the judge sets a support payment, i.e. in only 2 out of 3 cases (Belmokhtar, 2014).

Likewise, focusing on the case of a couple with two dependent children is not without consequences[2], since with only one dependent child the amount of family benefits falls, meaning that the social benefits received by the mother would be lower (in particular the family allowance is paid only starting from the second child) as would her standard of living. Statistics provided by the Ministry of Justice indicate that the average number of children is 1.7 in the case of divorces and 1.4 in the case of common-law unions (Belmokhtar, 2014).

Finally, nothing is said explicitly about the marital situation prior to the separation: marriage or common-law?

– Either the authors are considering married couples. In this case, if the salaries of the ex-spouses are different (case 4 described as “Asymmetry of income”), how is the loss of France’s marital quotient benefit (quotient conjugal) distributed? After divorce, the tax gain resulting from joint taxation is lost: the man then pays a tax amount based on his own salary and no longer on the couple’s average salary. This additional tax burden hits his living standard, and the “living standard sacrifice” calculated for the divorced father would then partly reflect the loss of this marital quotient benefit, and not the cost arising from the expense of a separated child.

– Or the authors consider only common-law couples, which seems to be the case given the vocabulary used – “separation, union, separated parents, etc.” – but then this brings back the criticism about the representativeness of the typical cases, since more than half of the court decisions regarding the children’s residence are related to divorces (Carrasco and Dufour, 2015). Moreover, the support payments set by the judge are all the more distant from the scale in the case of a separation and not a divorce, which limits the scope of the study.

On the proper use of equivalence scales

Equivalence scales are used to compare the living standards of households of different sizes, by applying consumption units (CU) to establish an “adult equivalent”. These scales are based on strong assumptions that do not allow the use of this tool in just any old way, i.e.:

– that individuals belonging to a single household pool their resources in entirety;

– that people belonging to the same household have the same standard of living (the average standard of living is calculated by dividing the total household income by the number of household CUs). This assumption flows from the first; the standard of living is equated with well-being.

Equivalence scales give an estimate of the additional cost linked to the presence of an additional person in a household. They say nothing about the way in which resources are actually allocated within the household. This is due to the hypothesis that resources are pooled, which is questionable (see in particular Ponthieux, 2012) and which leads to attributing the household’s average standard of living to each individual member. A couple has 1.5 CU. In fact, a couple A in which the man earns 3 times the minimum wage (SMIC) and the woman 0 times the SMIC would have the same standard of living as a couple B in which both earn 1.5 times the SMIC. This method can be used to compare the average living standards of two households, but not the living standards of the individuals who compose them. The woman in couple B probably has an individual standard of living that is higher than the woman in couple A, due to her greater bargaining power given the equal wages earned. So comparing the average living standards of the couple with the living standards of the individuals when the couple separates is misleading.

Likewise, to assess the financial burden represented by the children for the separated mother, for example, the authors apply the CU ratio linked with the children out of the total household CUs to the woman’s disposable income (salary minus the taxes paid, plus the benefits received and the support payment by her ex-partner for the two children in her care). But there is nothing to say that the separated mother does not allocate more resources to the children than is estimated by the CU ratio (with regard to housing, for example, she might sleep in the living room so that the kids each have their own room).

The methodological criticisms made of equivalence scales limit their use (see Martin and Périvier, 2015). They are not suitable for comparing the living standards of individuals, but only the living standards of households of different sizes.

What about the child’s standard of living?

There is not much literature estimating the standard of living of separated parents. To fix CUs per child in accordance with the marital status of their parents (in couples or separated), the authors rely on an Australian study that leads them to increase the CU attributed to children once the parents are separated. The cost of a child of separated parents is higher than that of a child living with both parents. They opt for the following formula:

– a child living with both parents corresponds to a CU of 0.3;

– a child living with the mother in conventional custodial care is 0.42 CU and 0.12 for the non-custodial father, i.e. 0.54 total CU for the two households.

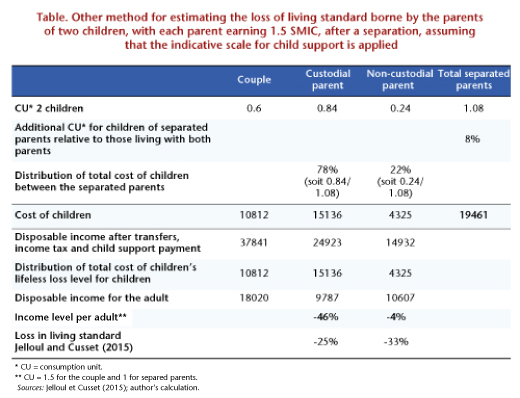
Thus the cost of a child of a separated parent is 80% higher than that of a child living with both parents. It is likely that most separated parents do their best to keep the lives of their children unchanged after a separation. An approach that seeks to maintain the child’s standard of living makes it possible to take this into account. By increasing the cost of children by 80% when they live with both parents, and redistributing this in proportion to the CUs allocated for the children of separated parents, the custodial parent has a greater loss in living standard than that of the non-custodial parent (see the Table). This method is also questionable because it applies the additional CUs of children of separated parents over children living in couples to the monetary cost calculated in the case of a couple raising the children. But if this approach is chosen, then the result is reversed.

Table_post06-07_English-corrige

Any statistical analysis is based on assumptions used to “qualify” what we want to “quantify”, which is inevitable (either because we do not have the information, or for reasons of simplification and to facilitate interpretation). Assumptions that are too strong, results that are too sensitive, and perfectible methodologies are the daily lot of researchers. Providing insights, asking good questions, opening up new perspectives, feeding and feeding off of contradictions – this is their contribution to society.

The study published by France Strategy has the merit of initiating a debate on a complex subject that is challenging for our tax-benefit system. But the answers that it gives are not convincing. While the authors acknowledge that, “The interest of these simulations is above all illustrative,” they nevertheless also want that “at least they provide judges and parents with a tool to simulate the financial position of two households that have resulted from a separation by integrating the impact of the tax-benefit system”. This seems premature in view of the fragility of the results presented.


[1] To compare the standard of living of households of different sizes, equivalence scales are estimated from surveys and using a variety of methods. They are used to refer to an “adult equivalent” standard of living, or a “consumer unit” (CU). From this perspective, the standard of living of a household depends on its total income, but also on its size (number and age of its members).

[2]  While Figure 7 of the working document summarizes the situations by the number of children, in the note the focus is on the case with two children.
What is a Left economics? (Or, why economists disagree)

By Guillaume Allègre

What is a Left economics? In an opinion column published in the newspaper Libération on 9 June 2015 (“la concurrence peut servir la gauche” [“Competition can serve the Left”], Jean Tirole and Etienne Wasmer reply that to be progressive means “sharing a set of values and distributional objectives”. But, as Brigitte Dormont, Marc Fleurbaey and Alain Trannoy meaningfully remark (“Non, le marché n’est pas l’ennemi de la gauche” [“No, the market is not the enemy of the Left”]) in Libération on 11 June 2015, reducing progressive politics to the redistribution of income leaves something out. A Left economic policy must also be concerned about social cohesion, participation in social life, the equalization of power, and we could also add the goals of defence of the environment and, more generally, leaving a fair legacy to future generations. Paradoxically, if the Left must not a priori reject market solutions (including the establishment of a carbon market), the de-commodification of human relations is also part of core left-wing values. The authors of these two columns insist that it is the ends that count, not the means: the market and competition can serve progressive objectives. This is not a new idea. The merchants of the 18th century had already understood that holding a private monopoly could allow them to amass great fortunes. Tirole and Wasmer draw on more recent debates, including on the issues of taxis, housing, the minimum wage, the regulation of the labour market, and university tuition fees. Their conclusion, a bit self-serving, is, first, that more independent evaluations are needed, and second, that our elected representatives and senior officials need to be trained in economics.

Does the Left define itself by values? To accept this proposal, we would need to be able to distinguish clearly between facts and values. Economics would be concerned with facts broadly speaking and would delegate the issue of values to politics. Disagreements about facts would be exaggerated. Political differences between the Left and the Right would be only a matter of where to put the cursor on values or preferences, which would be independent of the facts. According to this viewpoint, the instruments need to be designed by trained technicians, while the politicians just select the parameters. The Left and the Right would then be defined by parameters, with progressives more concerned about reducing inequality and conservatives more concerned about the size of the pie. In this scheme, disagreements among economists would be focused on values. Paradoxically, the examples used by Tirole and Wasmer are the subject of important controversies that involve more than just values: economists are very divided over the liberalization of the taxi business, the level of the minimum wage, and the possible introduction of university enrolment fees. There are important disagreements, even among progressive economists.

Why the disagreement? There are fewer and fewer disputes over the facts, strictly speaking. The system of statistics has made considerable progress. However, pockets of resistance remain. For example, on taxis, it is difficult to know who holds the licenses and the prices at which they were acquired, even though these are very important issues. If the vast majority of licenses are held by people who received them for free, then increasing the supply via private cars with drivers (“VTC”) poses no real problem of fairness. On the other hand, if most licenses were acquired on the secondary market at exorbitant prices (up to 240,000 euros in Paris), then the question of compensation arises. Buying 17,000 licenses at 200,000 euros apiece would cost the State 3.5 billion euros just for the licenses in Paris. This problem cannot be dismissed with a simple, “of course these are often expensive” (see “Taxis vs chauffeur-driven private cars: victory of the anti-innovation lobby?”).

While the facts are in little dispute, the disagreement often comes down to what matters. Should we put the emphasis on a lack of equal outcomes or a lack of equal opportunity? Should we count real estate gains when examining inequalities in capital? Should we be concerned about relative poverty or absolute poverty? Should we worry about inequality between households or between individuals? All this reflects that disagreements are not just a matter of where you put the cursor, but the prioritization of goals that are sometimes complementary and sometimes contradictory. The very way the system of statistics is constructed is not to produce pure facts but instead results from a logic that dictates that what you measure is the representation of a norm. But this norm is in fact reductive (it excludes others), so much so that the measure has meaning only from when we agree on the norm’s value: the measure is never neutral vis-à-vis values.

This vision of an economic science that can distinguish facts from values ​​is too reductive – it is often difficult to distinguish between the two. For example, depending on whether we measure the impact of tax policy on individuals or on households, the policy may be characterised as redistributive or as anti-redistributive. Often there is no easy solution to this problem, because it is difficult for the statistician to know how incomes are actually being shared within households. The current solution for measuring living standards and poverty is to assume that resources are fully shared within the household, regardless of the source of the income (labour income from one or another member, social welfare, taxation, etc.). Yet numerous studies show that for many households this assumption is false: empirical studies show that spending depends on who provides the resources, with women spending a larger portion of their income on the children.

Does the free character of the higher education system make it anti-redistributive? To public opinion this is obvious: the students come from wealthier families and will receive bigger salaries than those who don’t study, while everyone pays taxes, including VAT and the CSG wealth tax. This seems to be true if we think about it at time t. On the other hand, if you consider the life cycle the issue becomes more complicated: many students do not get high-paying jobs. School teachers, artists and journalists are often highly educated but make lower-than-average wages. For them, paying income tax is more advantageous than paying enrolment fees. Conversely, many people who have little education receive large salaries. Over the life cycle, having higher education paid for through income tax is redistributive (see “Dépenses publiques d’éducation et inégalités. Une perspective de cycle de vie” [“Public expenditure on education and inequality. A life cycle perspective”).

Should we measure income at the household level or individual level? Over the life cycle or at a given point in time? These examples show that what is measured by economists usually depends on a norm. This does not however mean that the measure is completely arbitrary and ideological. In fact, social science measurement is neither entirely normative nor merely descriptive: facts and norms are intertwined.

Economists do not reason simply with raw facts. They develop and estimate behavioural models. They do this to answer the question, “What if …?” What if we increased the minimum wage, what would be the impact on employment and wages at the bottom of the scale? You could classify the answer to such questions as facts. But unlike facts in the strict sense, they are not directly observable. They are generally estimated in models. However, the disagreements over these “facts” (the parameters estimated in the models) are very important. Worse, economists tend to greatly underestimate the lack of a consensus.

The parameters estimated by economists have meaning only within a given model. However, the disagreements between economists are not just about the parameters estimated, but the models themselves, that is to say, about the selection of simplifying assumptions. Just as a map is a simplification of the territory it represents, economic models are a simplification of the behavioural rules that individuals follow. Choosing what to simplify is not without normative implications. The best map depends on the degree of accuracy but also on the type of trip you want to make: once again, facts and values are intertwined. Differences between policies are not simply parametric, but arise from different representations of society.

Thus, contrary to the conclusion of Tirole and Wasmer, economic evaluations cannot be simply left to objective experts. In this respect, economists resemble other social scientists more than they do physicians: in fact, agreement on what constitutes good health is easier than on what constitutes a good society. Economic evaluations must therefore be pluralist, in order to reflect as much as possible the diversity of views in a society. What separates us from implementing the reforms needed is not a pedagogical deficit on the part of the experts and politicians. Nor is it simply a problem of educating the elite. There is obviously no agreement among the experts on the reforms needed. However, the economic reforms are often too technical to submit to a referendum and too normative to be left to the “experts”. To resolve this problem, consensus conferences and citizens’ juries seem relevant when the subject is normative enough to care about the representativeness of the participants and technical enough that we need to seek informed opinions. In economics, these kinds of conferences could deal with the issue of the individualisation of income taxes or carbon offset taxes. In short, economists are more useful when they make the trade-offs explicit than when they seek the facade of a consensus.


Still no halt to the rise in unemployment

OFCE Analysis and Forecasting Department

The unemployment data for the month of May once again show a rise in the number of job seekers registering at the Pôle Emploi job centre in Class A, up 16,200. Although this is certainly fewer than in April (26,200), it still leaves no glimpse on the horizon of a reversal in the unemployment curve. This continuous increase in unemployment, despite some initial shoots of recovery, is not surprising. The renewed GDP growth in the first quarter (+0.6% according to the detailed accounts published by the INSEE Thursday morning) has yet to have an impact on employment, which has stagnated. For the moment, companies are taking advantage of the pick-up in activity to absorb the excess labour they inherited from the crisis (in English see the post introducing this study). Only once the recovery has proved to be sustainable will an increase in employment translate into a reduction in unemployment. The time it takes employment to adjust to economic activity, i.e. about three quarters, does not point towards a turnaround in the labour market in the short term.

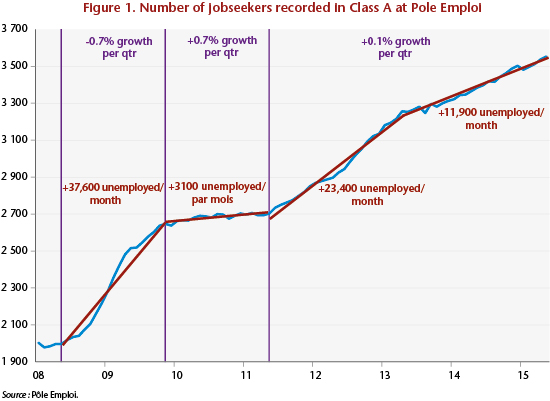
The last period of growth in France just following the 2008-2009 recession was moreover too brief to lead to a decline in the number of job seekers. With average growth of 0.7% per quarter from Q4 2009 to Q1 2011, the number of unemployed stabilized at best (Figure 1).

Since Q2 2011, growth has fallen to a very low level (0.1% per quarter), and unemployment has started rising again. However, a shift occurred in early 2013, with the monthly increase halved on average thanks to a renewal of the social treatment of unemployment through the creation of about 100,000 subsidized jobs in non-market sectors, as well as through enriching the growth in employment due to the implementation of the CICE tax credit and the Responsibility Pact.

Graphe1_post24-06ang

As growth gradually accelerates and the various measures to boost employment begin to kick in, a (slow) improvement will be seen in the second half of 2015.

The spectacular decline in exits from the Pôle Emploi agency

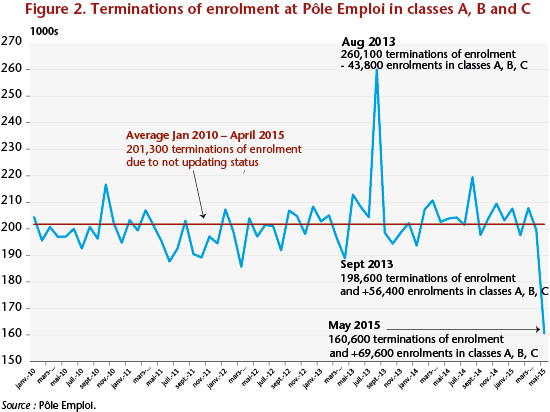
The 69,600 increase in the number of jobless registered with Pôle Emploi in Class A, B and C in the month of May, which is the worst figure recorded since the depths of the recession in April 2009, is surprising. The number of the unemployed broadly speaking, i.e. including unemployed people but also those working reduced hours, has been affected by unusual changes in the numbers of those exiting the job centre. About 43% of exits from the job centre are attributable to a termination of enrolment due to the non-renewal of the monthly job application for unspecified reasons, but which may be related for example to a resumption of activity, discouragement, temporary unavailability or even simply an oversight.

On average over the last five years, every month there were 200,000 terminations of enrolment due to this failure to renew. Some months, the grounds for termination can vary sharply, temporarily throwing off the unemployment statistics. For example, in August 2013, the “SFR bug” (Figure 2), i.e. a computer failure at the mobile phone operator, prevented many jobseekers from updating their status, which resulted in a sharp rise in the terminations of enrolment (+260,100). Due to the effect of a very high flow of exits from Pôle Emploi, the number of job seekers in Classes A, B and C fell by 43,800 in August 2013. The following month, as the number of terminations of enrolment returned to a level that was close to its long-term average, the unemployment figures logically rose sharply (+56,400 in September 2013), correcting for the effect of the artificial fall in the previous month.

In terms of the figures for May 2015, the phenomenon was the opposite of what happened during the SFR bug in August 2013. In fact, having noticed that the number of job seekers who updated their status following the normal reminder was significantly lower than usual, Pôle Emploi issued two additional reminders, which led to an unusually low level of terminations of enrolment (+160,600) compared with the historical trend (201,300). This mechanically increased the numbers in class A, B and C, at a rate that Pôle Emploi calculates at between 28,000 and 38,000.

But if next month the number of terminations of enrolment returns to a level close to its long-term average, this would wind up lowering the number of job seekers in class A, B and C without this reduction being the result of any change in the labour market. We must therefore insist on the need for caution in making any month-by-month interpretation of the unemployment data.

G2_Post2506ang


Greece: an agreement, again and again

By Céline Antonin, Raul Sampognaro, Xavier TimbeauSébastien Villemot

… La même nuit que la nuit d’avant                  […The same night as the night before
Les mêmes endroits deux fois trop grands          The same places, twice too big
T’avances comme dans des couloirs                     
You walk through the corridors
Tu t’arranges pour éviter les miroirs                     
You try to avoid the mirrors
Mais ça continue encore et encore …                    
But it just goes on and on…]

Francis Cabrel, Encore et encore, 1985.

Just hours before an exceptional EU summit on Greece, an agreement could be signed that would lead to a deal on the second bail-out package for Greece, releasing the final tranche of 7.2 billion euros. Greece could then meet its deadlines in late June with the IMF (1.6 billion euros) as well as those in July and August with the ECB (6.6 billion euros) and again with the IMF (0.45 billion euros). At the end of August, Greece’s debt to the IMF could rise by almost 1.5 billion euros, as the IMF is contributing 3.5 billion euros to the 7.2 billion euro tranche.

Greece has to repay a total of 8.6 billion euros by September, and nearly 12 billion by the end of the year, which means funding needs that exceed the 7.2 billion euros covered by the negotiations with the Brussels Group (i.e. the ex-Troika). To deal with this, the Hellenic Financial Stability Fund (HFSF) could be used, to the tune of about 10 billion euros, but it will no longer be available for recapitalizing the banks.

If an agreement is reached, it will almost certainly be difficult to stick to it. First, Greece will have to face the current bank run (despite the apparent calm in front of the bank branches, more than 6 billion euros were withdrawn last week according to the Financial Times). Moreover, even if an agreement can put off for a time the scenario of a Greek exit from the euro zone, the prospect of exceptional taxes or a tax reform could deter the return of funds to the country’s banks. Furthermore, the agreement is likely to include a primary surplus of 1% of GDP by the end of 2015. But the information on the execution of the state budget up to May 2015 (published 18 June 2015) showed that revenue continues to be below the initial forecast (- 1 billion euros), reflecting the country’s very poor economic situation since the start of 2015. It is true that the lower tax revenues were more than offset by lower spending (down almost 2 billion). But this is cash basis accounting. The monthly bulletin for April 2015, published on 8 June 2015, shows that the central government payment arrears have increased by 1.1 billion euros since the beginning of 2015. It seems impossible that, even with an excellent tourist season, the Greek government could make up this lag in six months and generate a primary surplus of 1.8 billion euros calculated on an accrual basis.

A new round of fiscal tightening would penalize activity that is already at half-mast, and it could be even more inefficient in that this would create strong incentives to underreport taxes in a context where access to liquidity will be particularly difficult. The Greek government could try to play with tax collection, but introducing a new austerity plan would be suicidal politically and economically. Discussion needs to get started on a third aid package, including in particular negotiations on the reduction of Greece’s debt and with the counterparties to this relief.

Any agreement reached in the coming days risks being very fragile. Reviving some growth in Greece would require that financing for the economy is functioning once again, and that some confidence was restored. It would also require addressing Greece’s problems in depth and finding an agreement that was sustainable over several years, with short-term steps that need to be adapted to the country’s current situation. In our study, “Greece on the tightrope [in French, or the English-language post describing the study at http://www.ofce.sciences-po.fr/blog/greece-tightrope/],” we analysed the macroeconomic conditions for the sustainability of the Greek debt. More than ever before, Greece is on the tightrope. And the euro zone with it.


Investment behaviour during the crisis: a comparative analysis of the main advanced economies

By Bruno DucoudréMathieu Plane and Sébastien Villemot

This text draws on the special study, Équations d’investissement : une comparaison internationale dans la crise [Investment equations : an international comparison during the crisis], which accompanies the 2015-2016 Forecast for the euro zone and the rest of the world.

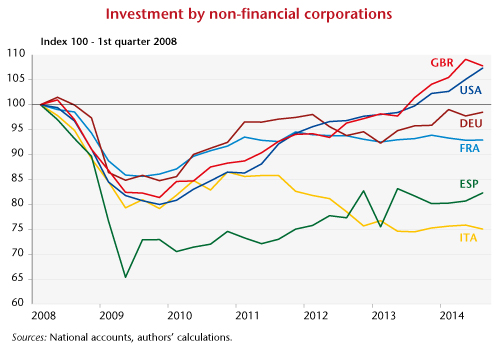
The collapse in growth following the subprime crisis in late 2008 resulted in a decline in corporate investment, the largest since World War II in the advanced economies. The stimulus packages and accommodative monetary policies implemented in 2009-2010 nevertheless managed to halt the collapse in demand, and corporate investment rebounded significantly in every country up to the end of 2011. But since 2011 investment has followed varied trajectories in the different countries, as can be seen in the differences between, on the one hand, the United States and the United Kingdom, and on the other the euro zone countries, Italy and Spain in particular. At end 2014, business investment was still 27% below its pre-crisis peak in Italy, 23% down in Spain, 7% in France and 3% in Germany. In the US and the UK, business investment was 7% and 5% higher than the pre-crisis peaks (Figure).

Our study estimates investment equations for six major countries (Germany, France, Italy, Spain, the UK and USA) in an effort to explain trends in investment over the long term, while paying particular attention to the crisis. The results show that using the traditional determinants of corporate investment – the cost of capital, the rate of profit, the rate of utilization of production capacity and business expectations – it is possible to capture the main developments in investment for each country in recent decades, including since 2008.

Thus, since the onset of the crisis, differences in decisions on taxation and on how tight to make fiscal policy and how expansive to make monetary policy have led to differences between countries in terms of the dynamics of the economy and real capital costs and profit rates, which account for the current disparities in corporate investment.

Graphe-post17-06_investENG


Save Greece by Democracy!

By Maxime Parodi @MaximeParodi, Thomas Piketty (Director of research at the EHESS and professor at Paris School of Economics), and Xavier Timbeau @XTimbeau

The newspapers have been full of the Greek drama since Syriza’s election to power on 25 January 2015. Caught in the noose of its loans, Greece’s government is defending its position by threatening to leave the euro zone. The situation today is at an impasse, and the country’s economy is collapsing. As bank deposits flee and uncertainty mounts about the times ahead and the measures to come, no-one is really able to think about the future.

Europeans, for their part, are wondering what has led to this state of affairs. There has been a diagnosis of Institutional incompleteness, with proposals to reinforce the construction of the euro zone. But what is emerging is not up to the challenges facing Europe.

So let’s take the problem by the other end of the stick and give European democracy a chance to evolve. Let’s entrust the resolution of the Greek debt crisis to a body of representatives of the euro zone’s national parliaments, that is to say, an embryo of a true parliamentary assembly for the euro zone.

Such an Assembly would arbitrate the conflict between the creditors and the Greek government, shifting the debate and decision-making to the big questions: what responsibility should the younger generation bear for the debt of their elders? What about the creditors’ rights? How have other large public debts been resolved historically, and what lessons can we draw for the future?

As any agreement reached would be legitimated by a formal assembly that would also act as its guardian, it would no longer be in danger of being denounced – once again – on the morrow. Since what’s at stake is to resolve a debt and to not reach an agreement through force, the first step would be to suspend Greece’s debt for the time needed. This step is a matter of common sense and the ordinary practice during the resolution of private debt in nearly all the world’s countries.

A lasting agreement

This would require leaving the IMF out of the discussion by letting Greece reimburse this institution. It would be necessary at the same time to eliminate the possibility of Athens leaving the euro zone. By accepting the principle of negotiations, Greece and the other European countries would take this option off the agenda and pledge to accept the agreement reached. This embryonic Assembly would periodically review the situation and monitor the contingencies of the Greek economy. This is in effect what is already being done today, but now this would be explained and legitimated.

The technical institutions (the Commission, the European Central Bank) would continue to assess and support the reforms envisaged. They would inform the Assembly and answer to it. The Assembly would be a body set up to arbitrate, whenever necessary, any conflicts. Nor would there be any reason not to involve the European Council and the European Parliament. But clarifying the issue of legitimacy would open the door to a solution that was both more constructive for Greece and the other heavily indebted countries and fairer to the taxpayers of the euro zone.

We would be experimenting with a scheme for the resolution of sovereign defaults within the euro zone by building a political union – while remembering one thing: that Europe was reconstructed starting back in the 1950s by investing in the future and forgetting the debts of the past, in particular Germany’s.

Finally, this Assembly would be competent to establish a common fund for euro zone debt, to undertake its global restructuring and to establish democratic rules governing the choice of a common level of public deficits and investments – which would help to overcome today’s Do-It-Yourself approach to our euro zone.


The free movement of Europe’s citizens in question

By Gérard Cornilleau

The British election has reignited the debate on the free movement of EU citizens within the Community. The fact that in less than 10 years the number of people originating from Central and Eastern Europe (mainly Bulgaria and Romania) has increased tenfold in the UK, rising, according to Eurostat, from 76,000 in 2004 to 800,000 in 2013, is undeniably behind this new unease around intra-European migration.

Further fuelling this debate over permanent migration is the issue of the free movement of seconded workers who travel to take up jobs in a country other than their country of residence with no justification other than the possibility of reducing labour costs by avoiding paying social security contributions in the host country.

EU legislation on the movement of citizens within the Community is ambiguous. On the one hand, workers have an absolute right to free movement, but this right is limited for the inactive population because in principle it should not lead to social expenditures by the destination States. European populations must thus remain socially connected to their State of origin. In theory, “social benefits tourism” is impossible, and not only are the Member States in no way compelled to take in hand intra-EU migrants, they are even entitled to expel them if their stay lasts more than 3 months and does not exceed 5 years. This was the holding of the European Court of Justice in a ruling on 11 November 2014, in the Dano case, named after a Romanian national living in Germany who was denied social assistance for herself and her son. The European Court held that she could not herself meet her own needs or those of her family and she was not looking for work. In these circumstances she did not have a right to residence in Germany or to the benefits of social assistance. The European Court recalled that European legislation on the freedom of movement was aimed at preventing EU citizens from other Member States from becoming an “unreasonable” burden on the social assistance system of the host Member State.

The available data on migration between European countries are relatively disparate and often incomplete. What is known is that there is little migration of inactive people who may be motivated by the pursuit of non-contributory social benefits. The same is essentially true for the migration of active workers. Europe remains in effect partitioned into linguistic blocs that limit the permanent movement of people between countries. Compared to the geographic mobility seen in the United States, the European Union is characterized by a low level of internal migration. While the statistics are not definitive, current assessments indicate that in the 2000s internal mobility was about 10 times lower in Europe than in the US: between 0.01 and 0.25% of the population of EU countries immigrated annually in the major European countries, in contrast to 1 to 1.7% in the US[1]. Since then, population movements have, it seems, increased a little in Europe while slowing in the US, but there has not been the kind of turnaround that would call into question the diagnosis that there is structurally less mobility in Europe.

As for the migration of inactive people, which is provoking fear of an increase in “benefit tourism” motivated by the search for generous non-contributory social assistance, the available data show that the potential for this is extremely low. A recent report for the Commission[2] estimates the population of non-active intra-European migrants at between 0.7% and 1% of the overall population in the major countries. Consequently, the share of social benefits paid to the corresponding population is extremely low. As a significant proportion of inactive migrants consist of students and retirees who have a sufficient income, the issue of benefit tourism therefore seems merely anecdotal.

While it is strict for the economically non-active, European legislation, which is very oriented towards free trade, promotes social competition between the Member States through a right to the secondment of workers from one country to another that is clearly too lax. This legislation was initially designed to promote the non-permanent mobility of corporate executives who wished to continue to benefit from the social security cover of their country of origin in the event of a long-term mission. But since the opening to Eastern Europe, some business sectors have made increasingly massive use of the possibility of hiring workers from other countries and paying low social contributions in the countries of origin, with no justification due to labour shortages or greater productive efficiency. In France, 10% of the workforce in the meat industry is now on secondment from other European countries. One hundred thousand construction workers, out of a workforce of 1.8 million workers, are in the same situation. Their labour cost is 20 to 30% lower than for nationals. In addition, due to the difficulty of checking on the payment of social contributions in their country of origin, many of these workers are in an irregular status. The Commission has of course proposed technical measures to more thoroughly verify the activity of the businesses seconding the workers as well as the payment of their contributions, but in all likelihood this will not be adequate to stem the strong growth of a movement that has its source directly in social competition.

What all these issues have in common is the demand for solidarity between European states, especially in deeds. Migratory movements, whatever their nature, tend to balance divergent developments in the labour market and the distribution of the population around the territory of the EU. There is no reason in principle to oppose greater mobility. On the contrary, given the current imbalances between European countries, increased mobility should be encouraged – without, of course, abandoning the macroeconomic, monetary and fiscal policies that represent the most effective tool for combatting economic divergences.

But an accommodative policy on mobility implies a distribution of immediate costs that cannot be accomplished without at least a minimum of convergence in the systems both for providing support to those who are worst off and for sharing a certain amount of resources. Clarifying the rules on social competition is also essential.

To avoid having mobility motivated solely by the search for lower labour costs, the principle of equal treatment of workers within a given country needs to be applied strictly. This implies that in the case of secondments, the social contributions should be levied at the rate of the country in which the employee is actually working. The amount of the contributions collected by the social security and tax authorities of the host country could be returned to the country of origin. There are two possible scenarios: if the contributions received exceed those that would have been paid without the secondment, there is no problem in financing the benefits paid to the seconded employees. In the opposite case (employees of large corporations in the richest countries seconded to poorer countries), an additional assessment could be imposed by the country of secondment. The principle of equal treatment of local and seconded workers is compatible both with a lack of direct social competition and with maintaining the rights of employees.

Lowering the barriers to the free movement of all EU citizens would on the other hand be greatly facilitated by the implementation of a plan to bring about a convergence in minimum compensations, whether we are talking about wages or social welfare. The establishment of a European minimum wage and a European minimum income would eventually eliminate social competition and do away with concerns that migration might be motivated solely by the search for non-contributory benefits. Furthermore, helping living standards catch up over the longer term would certainly be a way to strengthen confidence in the European Union project.

In the shorter term, solidarity between States must go hand in hand with loosening constraints on migration. This implies that States likely to take in citizens who are eligible for non-contributory social benefits should receive financial assistance from the Commission. This assistance could involve setting up a new European social budget that would cover the financing of a certain number of social minima. The EU budget could be increased by an additional 0.25 percentage point of GDP. Consideration should be given to whether a project like this for the partial Europeanization of social policy would benefit from such an increase in the EU budget. But other possible transfer mechanisms that would ensure financial solidarity between States for any non-contributory benefits paid to migrants could also be considered.

If we are to avoid States retrenching within their own borders and, ultimately, the long-term weakening of the European project, which was a contrario based on a desire for openness, it is undoubtedly time to revise a few principles and to establish a proactive programme for social convergence and for pooling the immediate costs that may result from mobility.


[1] See Mouhoud E.M and Oudinet J. (2006), “Migrations et marché du travail dans l’espace europée” [Migration and the labour market in the European space], Économie internationale, no. 105. Also see Xavier Chojnicki (2014), “Les migrations intra-européennes sont d’ampleur limitées et se concentrent sur les grands pays” |Intra-European migration is limited in scale and concentrated in the big countries], Blog du CEPII, Post from 4 September 2014. For a fuller analysis, see Ettore Recchi, Mobile Europe, The Theory and Practice of Free Movements in the EU, Palgrave Macmillan, London, 2015.

[2] See “Fact finding analysis on the impact on Member States’ social security systems of the entitlements of non-active intra-EU migrants to special non-contributory cash benefits and healthcare granted on the basis of residence”, DG Employment, Social Affairs and Inclusion via DG Justice Framework Contract, Final report submitted by ICF GHK in association with Milieu Ltd, 14 October 2013.


Is Emmanuel Macron approving a new industrial policy for France?

By Sarah Guillou

Support for industry is an economic issue that wins adherence from both Right and Left. The entire French political spectrum agrees on the importance of industry for the economy’s future. There is also a consensus among economists, who bring together a variety of sensitivities in recognizing the leading role industry plays in driving growth, mainly through exports and innovations – the manufacturing sector is responsible for over 70% of total exports and more than 75% of total R&D spending. This consensus is even international, to such an extent that, paraphrasing Robert Reich, it could be said that, “on the battlefield of national economic ambition, industry is the new boots on the ground”.

In France, everyone also agrees on deploring the decline in industrial jobs and more generally the de-industrialization that has seen industry’s share of total employment fall from 25% in 1990 to 10% in 2014. Deindustrialization, which has intensified since the 2007 crisis, crystallizes all the concerns about globalization and all the reproaches made to the French fiscal and regulatory environment.

Governments in general have been quick to support industry and have set up programmes to support innovation, SMEs and R&D spending. The research tax credit (CIR) set up in 1983 has been reinforced by government after government, and perfectly illustrates the political consensus on the matter. But since then numerous programmes to aid companies have been added, creating a tangle of schemes and local and national institutions, leading a recent OECD report to label the result relatively incoherent.

Unfortunately, it is clear that France’s economic and political consensus has not led to making its industry a global singularity in terms of performance. The country’s industrial policy has been unable to counteract the inexorable decline of industry in the face of the service sector.

But judging industrial policy in this way misconstrues its possible objectives. To understand what industrial policy involves, we need to shed our old habits.

On the one hand, opposing industry to services is outdated and is merely a statistical artefact. The services sector is poised to take over innovation and exports, but our statistics have not yet taken stock of these changes. We are still not very clear on how to measure productivity in services or how to understand the channels for innovation in this sector, which do not necessarily pass through R&D. Note, however, that among the companies that benefit from the CIR research tax credit, the number of services firms is increasing every year, reflecting their growing contribution to private R&D spending. Services are a very heterogeneous category: the “Information and communication” category, for example, is less distant from the manufacturing sector than from the real estate business. Furthermore, exports of services are still not well measured (or declared) and are not always very distinguishable from movements of capital. Veiled behind these imperfections in statistics, globalization is not sparing the services sector, which will form an increasing share of international transactions.

Still, for the moment, it is undeniable that the manufacturing sector governs R&D’s share of GDP and that the decline in France’s market share reveals the productive difficulties companies are experiencing. But we must begin now to anticipate the changes taking place in the boundaries between sectors and not become locked into a reading of economic activity that is incapable of grasping the areas where added value will be created in the future. Re-industrialization in the sense of increasing the role of manufacturing (or “a return to the age of doing”) is not necessarily the salvation of the economy of the future.

At the same time, industrial policy as such was not responsible for de-industrialization, nor is it able to counteract the decline in industrial employment.

The reasons for de-industrialization – beyond the important role played by technical progress – are to be found in the conditions governing the exercise of economic activity in France relative to the rest of the world: from the incentives to innovate to the incentives to invest, from taxation to regulation, from skills to productivity.

To put it another way, industrial policy was not the cause of the difficulties of Alstom, of AREVA or of Nokia’s takeover of Alcatel-Lucent, and even less so of the logistics merger of Norbert Dentressangle and XPO.

It should be recognized that France’s industrial policy is sometimes erroneously confused with what some call “industrial engineering”. As public companies have historically been the spearhead of industrial policy, policy had the distinctive feature of combining industrial logic with the logic of the economic and political powers, and the two were not always in synch. These inconsistencies could exacerbate the difficulties facing State-owned enterprises.

Industrial policy should content itself with boosting technological trajectories and promoting business growth. The renovation of industrial policy will involve a comprehensive approach to future technologies. The mechanisms for this will include the development of public-private partnerships and the outsourcing of operations to long-term independent administrative agencies. In this respect the political consensus needs to be extended to include the means for this in order to ensure the continuity of these agencies, so as to stabilize the institutional landscape in which business operates.

Industrial policy is the expression of technological orientations. It can be more or less interventionist and can go beyond more or less simple declarations of intent based on the budgets it is given, depending on overall budgetary constraints. It is especially critical that public funds are committed or private funds are directed so as to finance the demand placed on business. But it is necessary for this public financing to correspond to a genuine request by the State, such as the need for defence equipment to meet foreign policy or the conquest of space, or to a real decision to involve society in its use, such as green energy. Furthermore, in a democracy, the State’s request needs to have the support of society, which should be willing to finance, for example, green energy by paying more for carbon and fuel, along the lines of what has been done in Germany.

In this sense, Emmanuel Macron’s approach to industrial policy reflects a positive development. Cutting 34 future projects down to fewer than a dozen is relevant, because it helps to clarify the State’s commitments and make them more credible. In addition, the digital commitment is the transcription of a technological choice. At the moment “re-industrialization” is focused around the industries of the future, the digitization and modernization of industrial facilities. It would be more honest to dispense with the goal of “re-industrialization” since what is needed is to deal with the economy as a whole and modernize the means of production in order to make France’s productive tissue out of a new stronger fabric.

However, the stated objectives are not based on very risky technological choices and do not commit many resources: a 2.5 billion euro tax benefit for companies investing in their productive facilities over the next 12 months (the accelerated capital cost allowance – “sur-amortization” – announced a month ago) and 2.1 billion euros in additional development loans by BPI France for SMEs and ETI over the coming two years. This will thankfully not entail creating another intermediation body for the new policy. As for the role of the State shareholder, the speech was more serene vis-à-vis globalization and more encouraging with regard to European cooperation – as has been shown in the reaction to Nokia’s merger process with Alcatel Lucent. The Minister’s decisions do not however seem to be departing from a full neutrality, as can be seen in the case of the double voting shares that the State has imposed on Renault.

The overhaul of industrial policy remains modest in terms of resources and goals, but it has the merit of setting objectives for policy that it might actually be able to meet.


A fall in the unemployment rate according to the ILO: the false good news

By Bruno Ducoudré and Eric Heyer

Two days following the announcement by France’s unemployment agency Pôle Emploi of an increase in Class A job seeker registrations in April, which comes on top of a first quarter increase, the INSEE statistics agency has published its estimate of the unemployment rate. Under the definition of the International Labour Office (ILO), the unemployment rate in metropolitan France fell by 0.1 point in the first quarter of 2015, meaning 38,000 fewer unemployed than in the fourth quarter of 2014. But according to Pôle emploi, over this same period the number of registered Class A job seekers rose by 12,000. In one case, unemployment is falling; in the other, it is rising: this does not make for a clear diagnosis of what’s happening with unemployment at the start of the year.

What accounts for the different diagnoses of the INSEE and Pôle Emploi?

In addition to differences in methodology (a labour survey for the ILO, administrative data for Pôle emploi), note that to be counted as unemployed according to the ILO, three conditions have to be met: a person must be unemployed, available to work and conducting an active job search. Simply registering at the job centre is not sufficient to meet this last condition. So someone who is registered in Class A [1] at Pôle Emploi but is not conducting an active search is not counted as unemployed according to the ILO. The ILO criteria are thus more restrictive. Historically, the number of unemployed registered at the job centre is higher than that calculated according to the ILO for persons aged 25 and over. Young people under age 25 generally have less incentive to register at the job centre [2].

tab1_0406ang

Except for the under-25s, the unemployment figures from Pôle Emploi are therefore worse than those for the ILO and hence the INSEE (Table 1). The explanation is as follows. In labour market conditions that have worsened considerably, some unemployed people have become discouraged and are no longer actively seeking employment: they are thus no longer counted as unemployed according to the ILO. Yet they are continuing to update their status with the job centre and thus remain registered as unemployed in Class A. This results in an increase in the “halo” of the unemployed, i.e. people who want to work and are readily available but are not actively seeking a job. This unemployment “halo” has increased by 71,000 people in one quarter.

In first quarter 2015, the ILO-based unemployment rate fell for the wrong reasons

There are two reasons why the unemployment rate may fall: the first, virtuous reason is that people are exiting unemployment due to an improvement in the labour market; the second, less rosy reason is that some unemployed people are drifting into inactivity. The latest ILO statistics highlight that the 0.1 point fall in the unemployment rate was due entirely to the decline in the labour force participation rate – which measures the percentage of people in the population aged 15 to 64 who are active – and not to a recovery in employment, which, on the contrary, has declined. So the drop in the unemployment rate is due not to a recovery in employment, but to discouragement among unemployed people who are no longer actively seeking work (Table 2).

tab2_0406postang

More specifically, the entry of young people into the labour market at a time when employment is declining is being reflected in a 0.1 point rise in joblessness in this category. Among seniors, the employment rate is continuing to increase (0.2 points) due to the postponement of the effective retirement age. It is true that ILO unemployment is falling among seniors, but the rising numbers in this age group enrolling at the job centre (Table 1) undoubtedly reflects a change in their job search behaviour: more and more of them are no longer making a job search and are now classified in the “halo” of unemployment.

Ultimately, the fall in the ILO-defined unemployment rate, which is marked by both a lack of recovery in employment and discouragement among some of the unemployed, is not such good news.


[1] People registered in Class A have not worked at all, even on reduced hours, unlike those registered in Classes B and C.

[2] To be entitled to unemployment compensation and to receive back-to-work assistance (“ARE”), 122 days of affiliation or 610 hours of work must be shown during the 28 months preceding the end of the job contract.


Unemployment figures: the chill returns in April

By Analysis and Forecasting Department (OFCE-DAP)

While the slowing increase in the number of job seekers registered with France’s Pôle Emploi unemployment agency in the first quarter of 2015 could be seen as the premise of the long-awaited downturn in the unemployment curve, the figures released today once again cast doubt on this prospect, at least in the short term. The registration of 26,200 additional people in category A at the agency in April brings the increase in job seekers back to a high rate, well above the average over the last two years (13,400 per month) and far from the virtual stability seen in the first quarter (+3,000 per month).

While the publication of strong figures for first-quarter GDP growth (+ 0.6%) reaffirmed the prospect of a recovery, the jobless numbers are disappointing. Don’t forget, however, that employment does not immediately respond to a pick-up in activity; it will take time to reap the benefits for the labour market of the good growth experienced at the year’s beginning, when the recovery has proven to be strong, pushing employers to recruit. For now, companies are still digesting the overstaffing inherited from the period of very low growth between 2011 and 2014. The fall in unemployment that can be foreseen with the recovery will not take place until the second half of 2015. But the acceleration of job centre registrations in April sends a contrary signal.

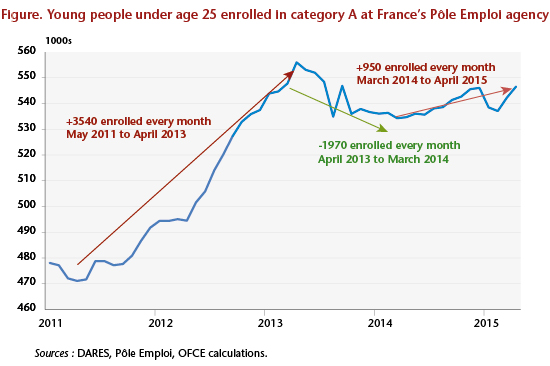
The situation seems to be generally worsening among all sections of job seekers: men, women, and all age categories. The number of unemployed under age 25 has been rising again the last months (9,500 people). But changes like these are often volatile, and should be treated with caution: they come in counterpoint to an equivalent fall in numbers during the first two months of 2015. Over a one-year period, the increase was only 11,900, and the interruption in the rise in youth unemployment since April 2013 signalled success for the jobs policy targeted at this group (see the figure). The announcement by the Minister of Labour of the creation of 100,000 additional subsidized jobs reflects the government’s perhaps belated determination to beef up this programme at a time when the economic outlook is improving.

Gaphe_post1-06ang