By Bruno Ducoudré and Pierre Madec
According to figures from the French statistics institute (INSEE) published on 12 May 2017, non-agricultural commercial employment in France increased (+0.3%) in the first quarter of 2017 for the eighth consecutive quarter. Employment rose by 198,300 in one year. Despite the improvement on the jobs front experienced since 2015, the impact of the crisis is still lingering.
Since 2008, employment trends have differed significantly within the OECD countries. Unemployment rates in the United States, Germany and the United Kingdom are now once again close to those seen before the onset of the crisis, while the rates in France, Italy and particularly Spain still exceed their pre-crisis levels. Changes in unemployment reflect the gap between changes in the active population and changes in employment. An improvement in unemployment could therefore mask less favourable developments in the labour market, in terms of employment behaviour (changes in the labour force participation rate and the “unemployment halo”) or an increase in precarious employment (involuntary part-time work, etc.). In this paper we take another look at the contribution of changes in participation rates and in working time duration relative to changes in unemployment rates and to a broader measure of the unemployment rate that encompasses the “halo of unemployment” and involuntary part-time work.
Unemployment rates are marked by the crisis and reforms
With the exception of the United States, employment rates have changed considerably since 2008. In France, Italy and Spain, the employment rate for 15-24 year-olds and for those under age 55 more generally has fallen sharply (Figure 1). Between the first quarter of 2008 and the last quarter of 2016, the employment rate for 18-24 year-olds fell by 19 percentage points in Spain, by more than 8 percentage points in Italy and by almost 4 percentage points in France, while at the same time the unemployment rates in these countries rose by 9, 5 and 3 percentage points respectively. The poor state of the economy in these countries, accompanied by negative or weak job creation, has hit young people entering the labour market hard. Conversely, over this same nine-year period, the employment rate of individuals aged 55 to 64 increased in all the above countries. In France, as a result of successive pension reforms and the elimination of the job search exemption, the employment rate of older workers increased by 12.3 percentage points in nine years to 50% in Q4 2016. In Italy, even though the labour market worsened, the employment rate of 55-64 year-olds has risen by almost 18 percentage points.
A sharp impact of the participation rate on unemployment, offset by a reduction in working time
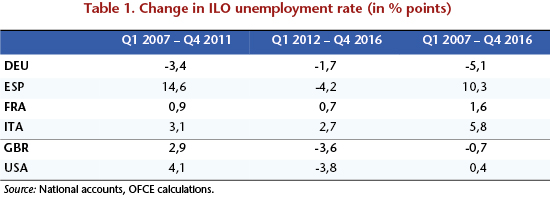
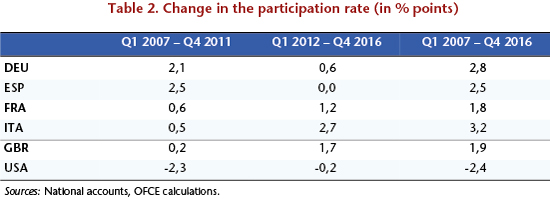
During the course of the crisis, most European countries reduced the actual working hours to a greater or lesser extent by means of partial unemployment schemes, the reduction of overtime and the use of time-savings accounts, but also through the expansion of part-time work (particularly in Italy and Spain), including involuntary part-time work. On the other hand, the favourable trend in unemployment in the US (Table 1) is explained partly by a significant decline in the labour force participation rate of people aged 15 to 64 (Table 2). The rate in the last quarter of 2016 was 73.1%, i.e. 2.4 points less than at the beginning of 2007.
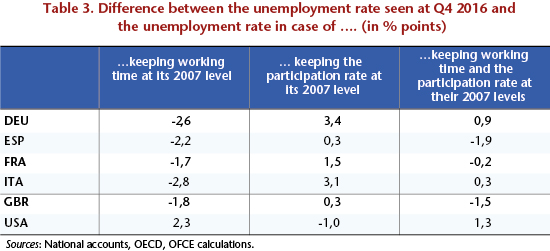
Assuming that a one percentage point increase in the labour force participation rate leads, holding employment constant, to a 1 percentage point increase in the unemployment rate, it is possible to measure the impact of these adjustments (working hours and participation rate) on unemployment, by calculating an unemployment rate at constant employment and controlling for these adjustments. Except in the United States, all the countries studied saw a greater increase in their labour force (employed + unemployed) than in the general population, owing, among other things, to pension reforms. Mechanically, absent job creation, this demographic growth has the effect of increasing the unemployment rate of the countries concerned.
If the labour force participation rate remained at its 2007 level, the unemployment rate would fall by 1.7 percentage points in France, 2.8 percentage points in Italy and 1.8 percentage points in the United Kingdom (Table 3). On the other hand, without the large contraction in the US labour force, the unemployment rate would have been at least 2.3 percentage points higher than in 2016. It also seems that Germany experienced a significant decline in the level of its unemployment (‑5.1 points), even though the participation rate rose by 2.8 percentage points. For an unchanged employment rate, the German unemployment rate would be 1.3% (Figure 2).
As regards working hours, the lessons seem quite different. It seems that if working time had been maintained in all the countries at its pre-crisis level, the unemployment rate would be higher by 3.4 points in Germany, 3.1 points in Italy and 1.5 points in France. In Spain and the United Kingdom, working time has changed very little since the crisis. By controlling for working time, the unemployment rate changes in line with what was observed in these two countries. Finally, without adjusting for working time, the unemployment rate in the United States would be 1 point lower.
Note that this trend towards a reduction in working hours is an old one. Indeed, since the end of the 1990s, all the countries studied have experienced large reductions in working time. In Germany, this decline averaged 0.5% per year between 1998 and 2008. In France, the transition to the 35-hour work week resulted in a similar decrease (-0.6% per year) over that period. Overall, between 1998 and 2008, working hours were down 5% in Germany, 6% in France, 4% in Italy, 3% in the United Kingdom and the United States, and 2% in Spain.
Beyond the “unemployment rate”
In addition to obscuring the dynamics affecting the labour market, the ILO’s (International Labour Organization) strict definition of unemployment does not take into account situations on the margins of unemployment. So people who wish to work but are considered inactive in the ILO sense, either because they are not quickly available for work (in under two weeks) or because they are not actively seeking employment, form what is called a “halo” of unemployment.
The OECD’s databases can be used to integrate into the unemployed category people who are excluded by the ILO definition. Figure 3 shows for the years 2008, 2011 and 2016 the observed unemployment rate, to which are added, first, people who are employed and declare that they want to work more, and second, individuals who are inactive but want to work and are available to do so. In Germany, the United Kingdom and the United States, changes in these various measures seem to be in line with a clear improvement in the labour market situation. On the other hand, between 2008 and 2011, France and Italy experienced an increase in their unemployment rates, especially from 2011 to 2016, both in the ILO’s strict sense of the term and in a broader sense. In Italy, the ILO unemployment rate increased by 3.4 percentage points between 2011 and 2016. At the same time, underemployment rose by 3.2 percentage points and the proportion of individuals maintaining a “marginal relationship” with employment by 1 percentage point. Ultimately, in Italy, the unemployment rate including some of the jobseekers excluded from the ILO definition came to 26.5% in 2016, more than double the ILO unemployment rate. In France, because of a lower level of unemployment, these differences are less significant. Despite this, between 2011 and 2016, underemployment increased by 2.4 points while unemployment in the strict sense grew “only” by 1 percentage point. In Spain, although there was notable improvement in ILO unemployment over the period (-3 points between 2011 and 2016), underemployment continued to grow strongly (+1.5 points). By 2016, Spain’s ILO unemployment rate was 7 percentage points higher than it was in 2008. By including jobseekers excluded from the ILO measure, this difference comes to 11.0 percentage points.


Leave a Reply